🌍 Public
Activity-6_Question4
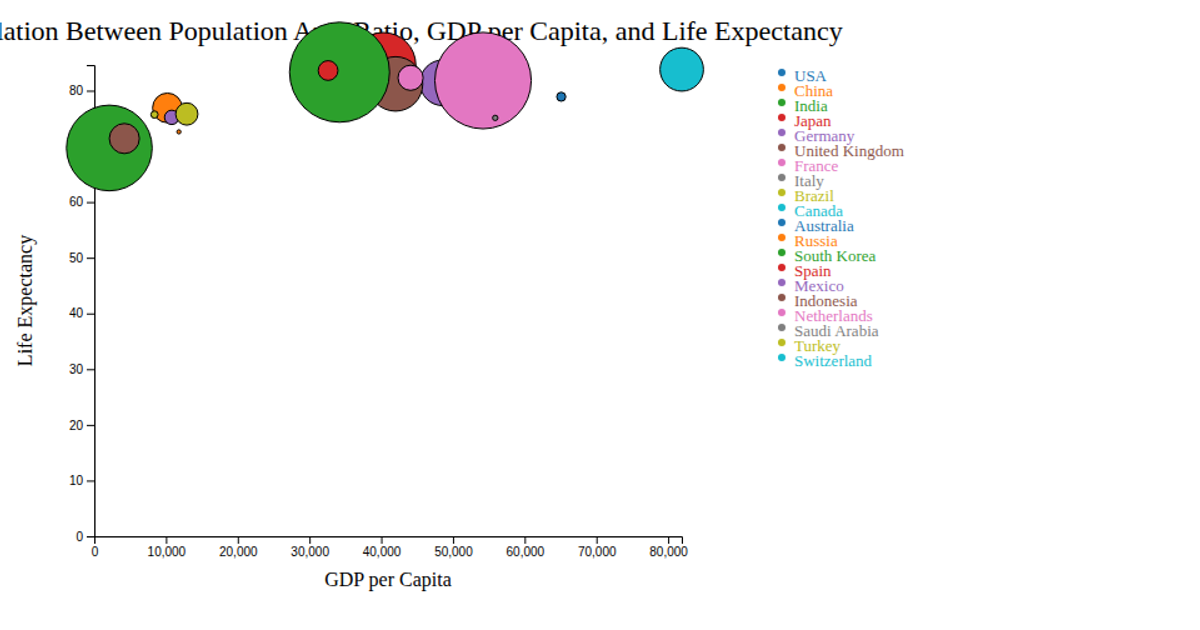
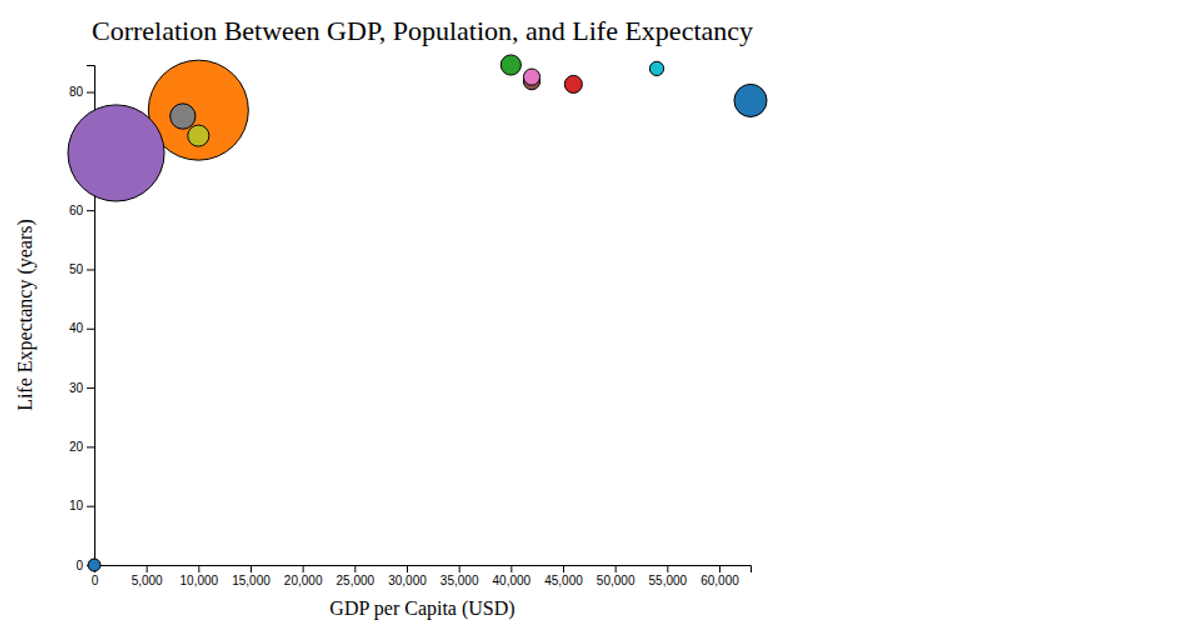
This bubble chart shows the correlation between GDP per capita, life expectancy, and population area ratio across 20 countries. Each circle’s position encodes GDP and life expectancy, while its size represents population density, with color distinguishing nations. A tooltip reveals exact values on hover. Built with D3 v7, it uses `d3.scaleLinear` for axes and bubble sizing, `d3.scaleOrdinal` with `d3.schemeCategory10` for colors, and SVG circles with mouse event handlers for interactivity. Data comes from `bubblechart.csv`, rendered with standard SVG elements and a categorical legend.
AI-generated descriptionMIT Licensed




Comments
Sign in to join the discussion.