🌍 Public
D3 of Bar Chart
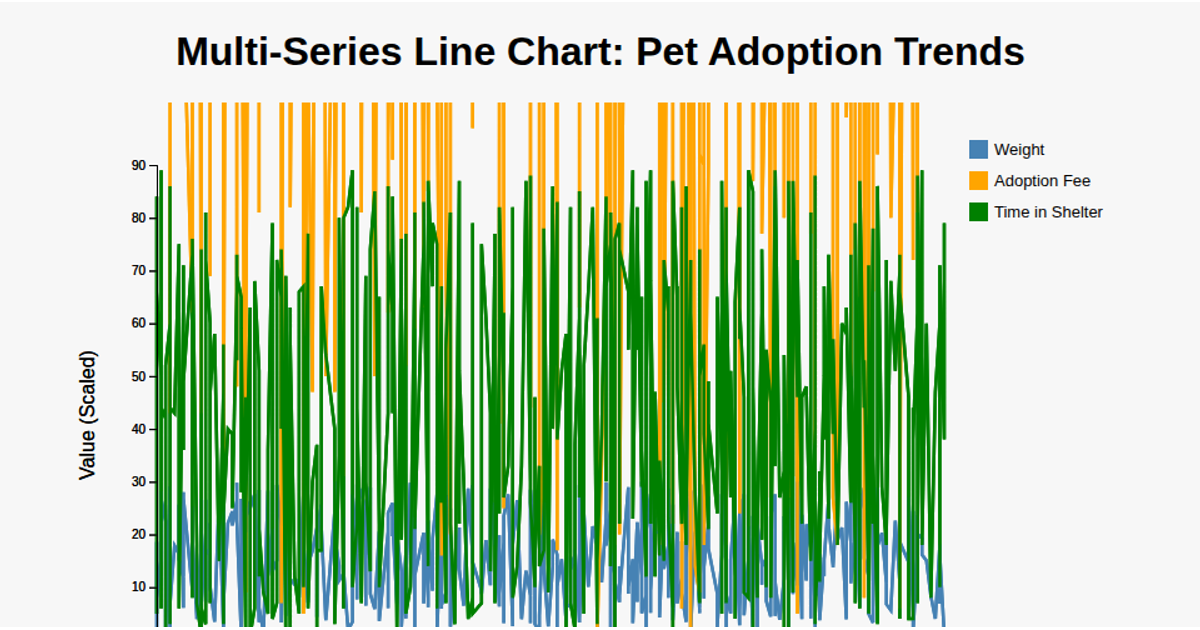
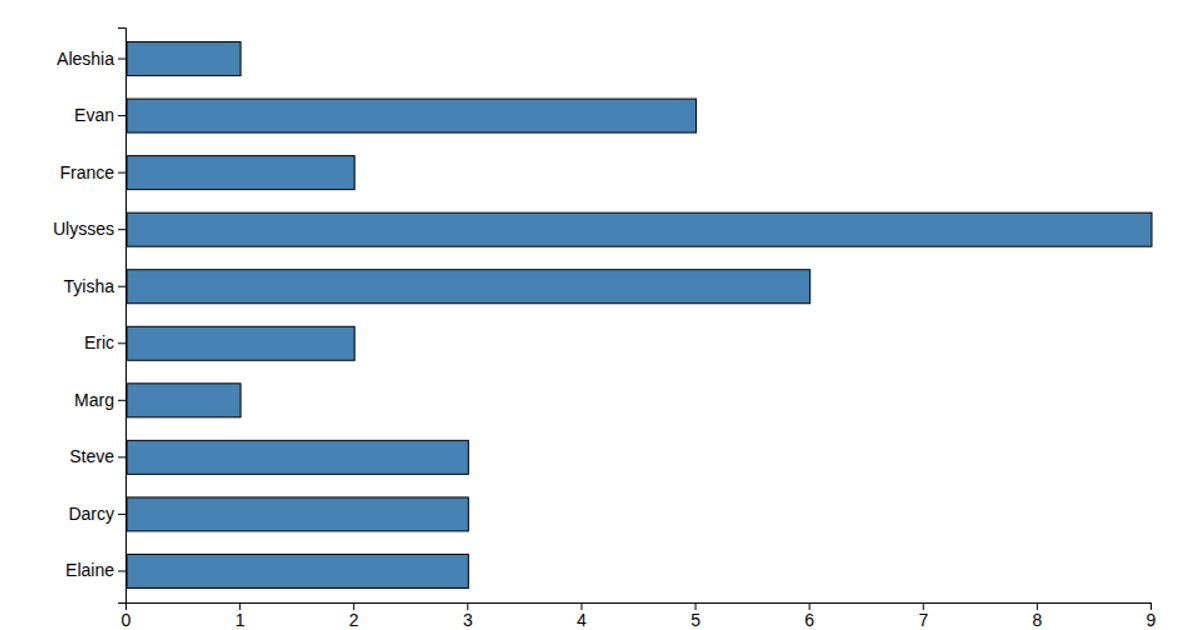
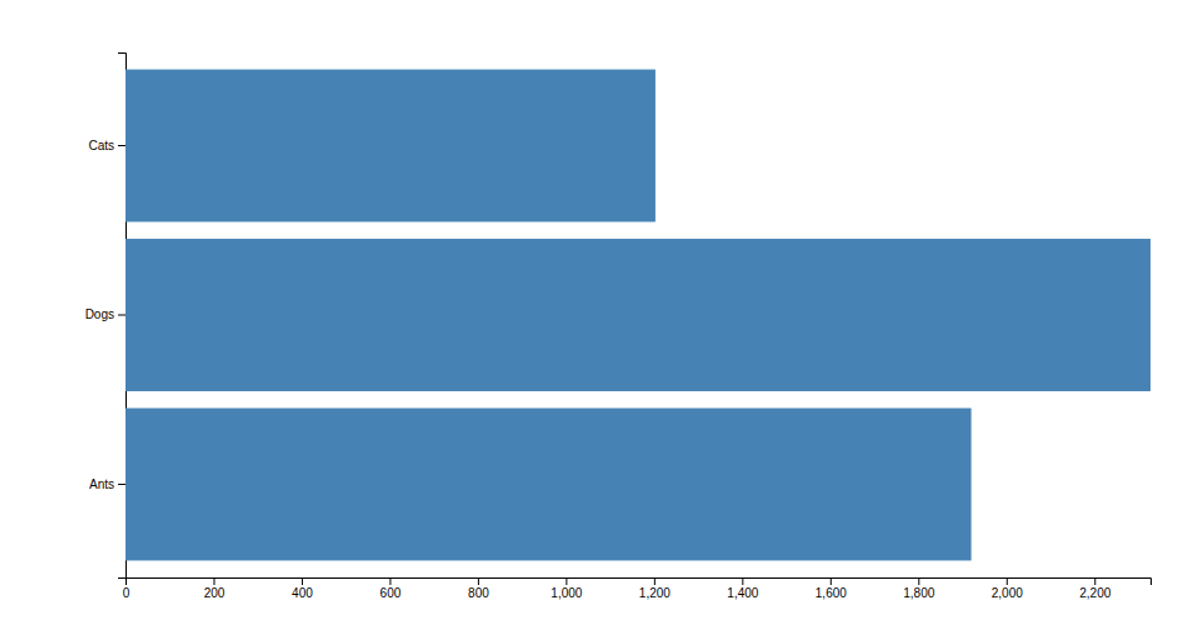
This bar chart displays the average weight of different pet types using a simple SVG rendering. The visualization loads CSV data with `d3.csv`, groups records by pet type with `d3.rollup`, and computes means with `d3.mean`. It builds a band scale for categories and a linear scale for values, then renders steel-blue rectangles and adds rotated axis labels. The chart includes a bold title and uses D3 v7’s selection methods to append axes and interactive hover styling.
AI-generated descriptionMIT Licensed





Comments
Sign in to join the discussion.