🌍 Public
D3 Bar+Line Chart
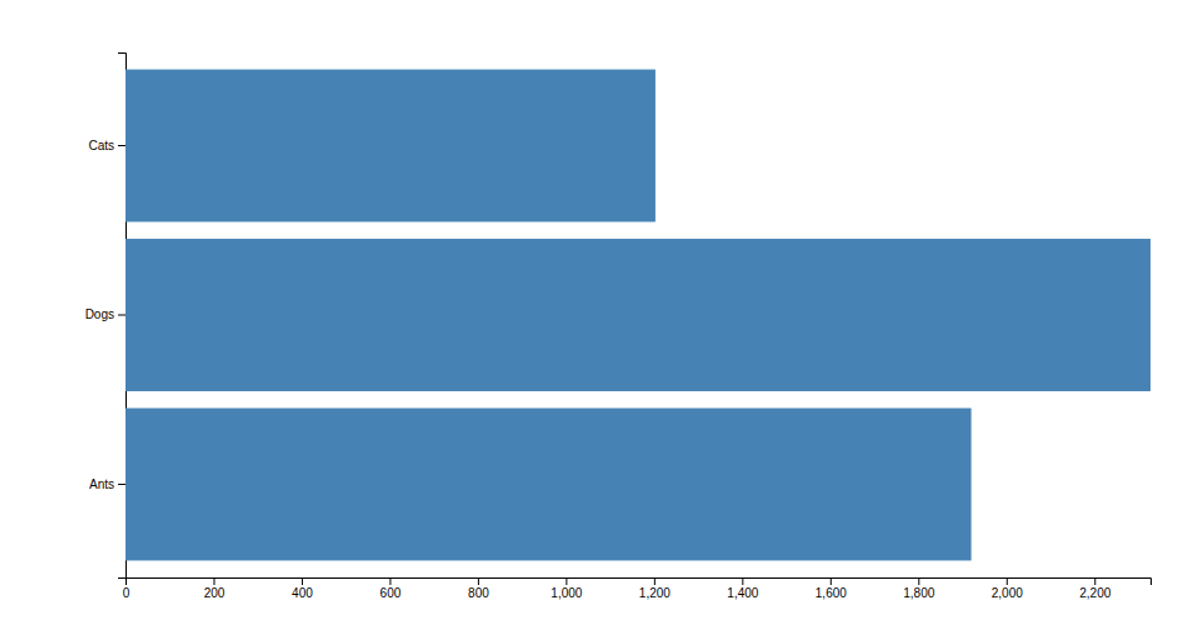
This multi-series line chart visualizes pet adoption data, plotting age against weight, adoption fee, and shelter time to show relative trends. The code uses D3.js v7 with an SVG canvas, scaling data via `d3.scaleLinear` and rendering lines with the `d3.line` generator. Data is fetched from a GitHub raw text file, with each series color-coded and labeled through a legend. The chart includes bottom and left axes with `d3.axisBottom` and `d3.axisLeft`, scaled for comparability.
AI-generated descriptionMIT Licensed






Comments
Sign in to join the discussion.