🌍 Public
Proberen eigen data te renderen
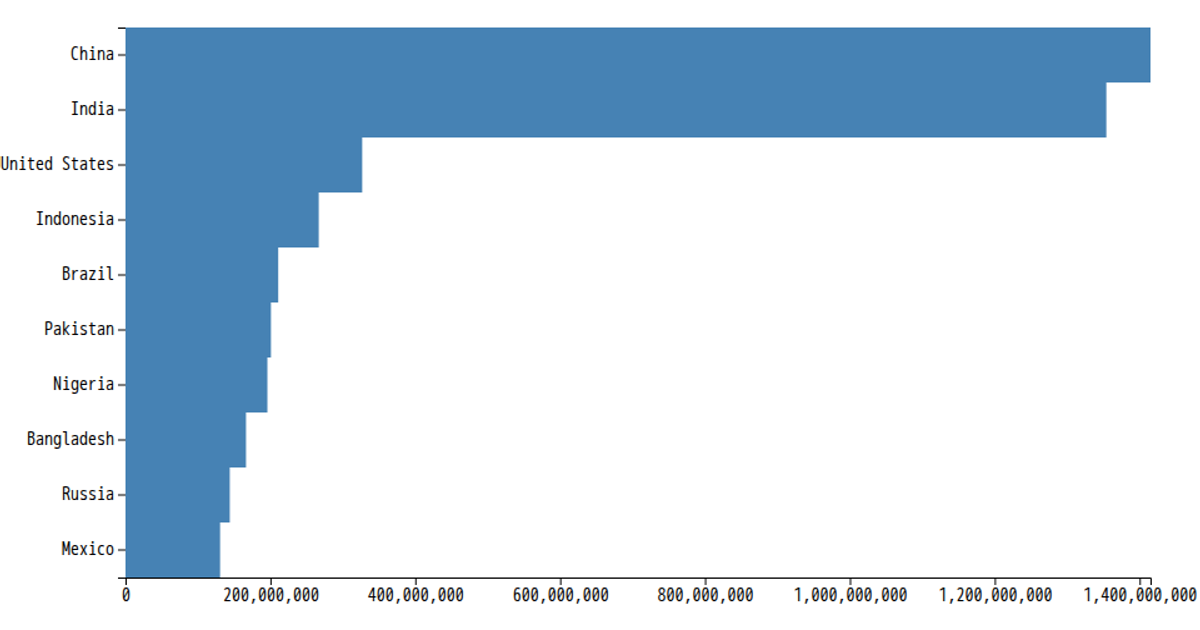
This example displays a horizontal bar chart of country populations. The chart uses a dark red fill for the bars and includes axis labels. The code attempts to fetch data from the RDW open data API but ultimately renders from a local CSV file, mapping the population values to the bar widths. It utilizes D3 v5 functions like `scaleLinear`, `scaleBand`, `axisBottom`, and `axisLeft` to construct the visualization within an SVG element.
AI-generated descriptionMy own barchart, make us of my own data (RDW/oplaadpunten.nl)
MIT Licensed



Comments
Sign in to join the discussion.