🌍 Public
Customizing Axe$()
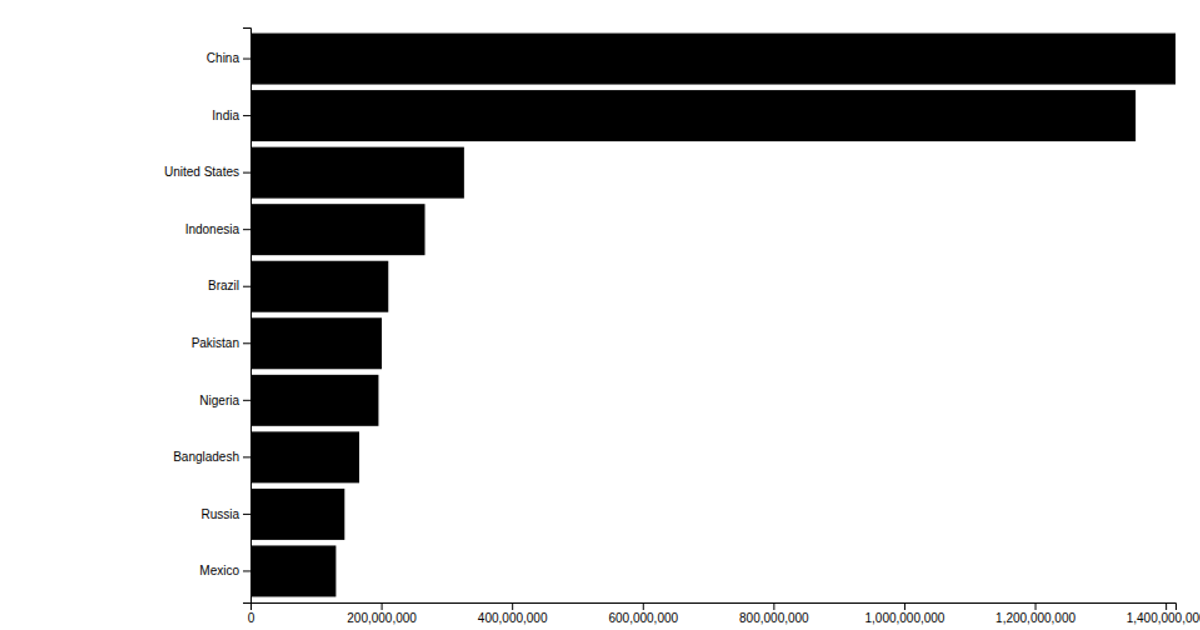
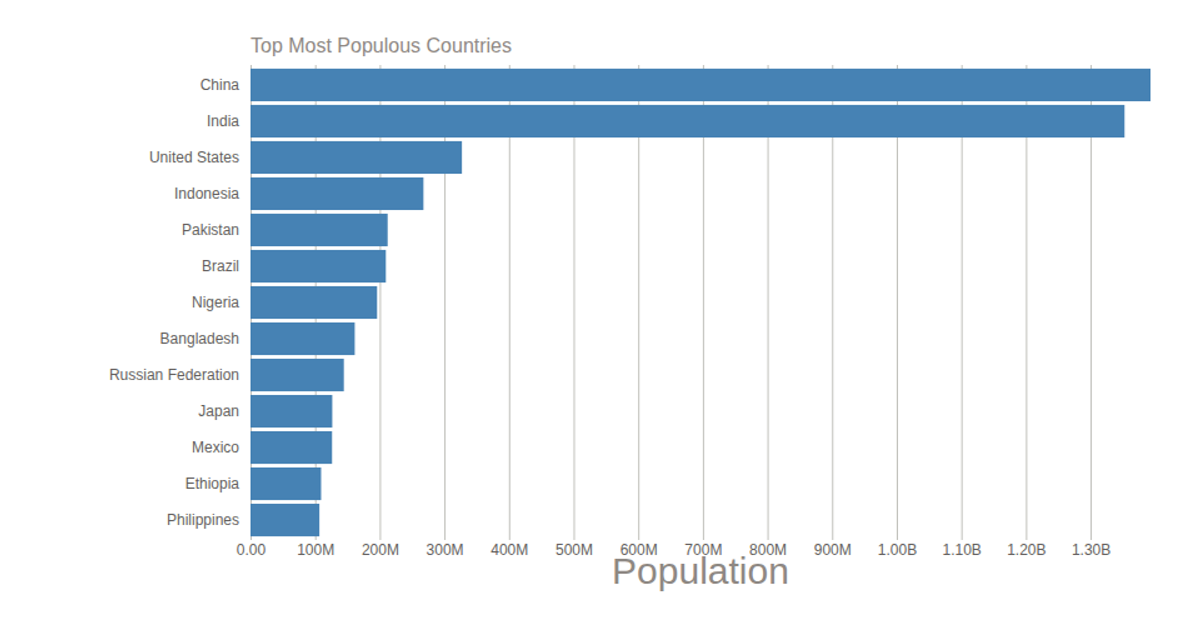
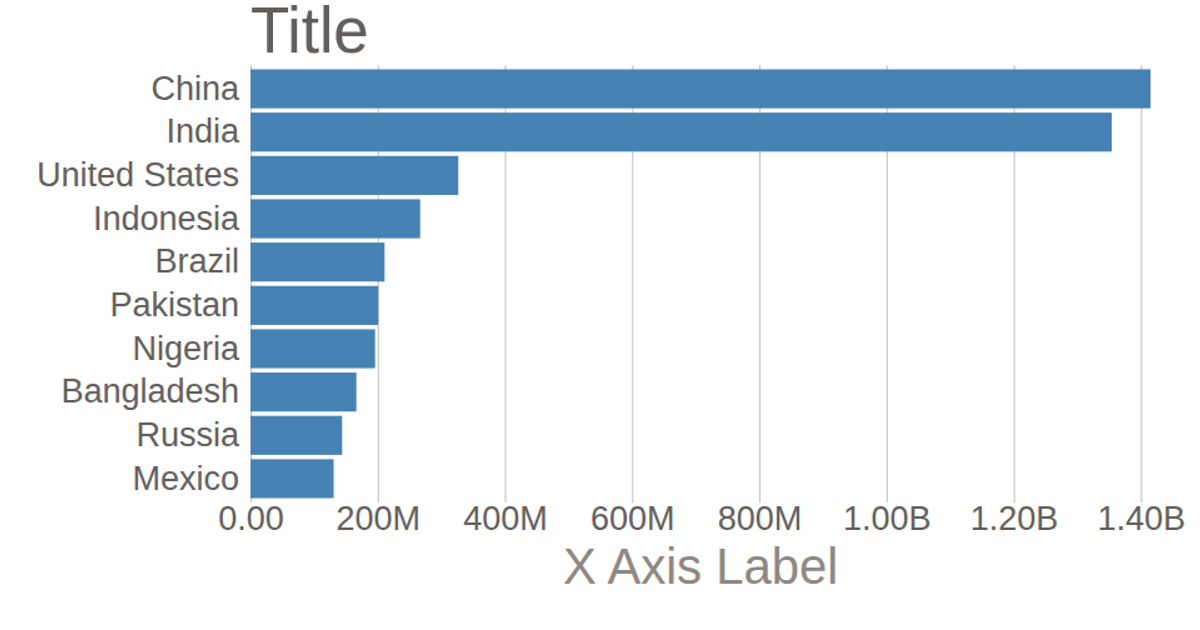
This example shows a horizontal bar chart of population by country and religion, using data loaded from a CSV file. It customizes the chart’s axes by removing default domain lines and tick lines, formatting tick labels (e.g., converting "G" to "B" for billions), and adding custom axis titles and labels. The code uses D3 v5 APIs such as `csv`, `scaleBand`, `scaleLinear`, `axisBottom`, `axisLeft`, and `format`, rendering to SVG.
AI-generated descriptionCustomizing the barchart Axes, following Curran's skills.
MIT Licensed




Comments
Sign in to join the discussion.