🌍 Public
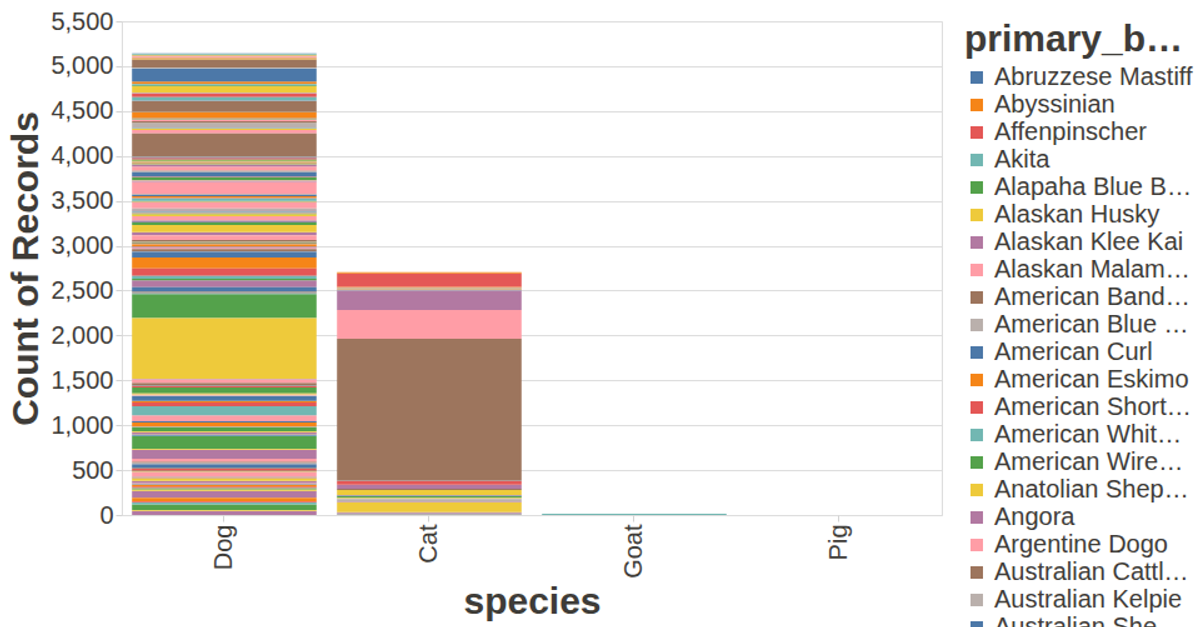
Types of pets by zipcode
QQingyue99
Last edited Apr 26, 2020
Created on Apr 26, 2020
Forked from Percent Bee Colony Loss by State and Year
This interactive heatmap displays the distribution of pet types across Seattle zip codes, with each cell colored by the count of a specific primary breed. The visualization uses a red sequential color scale to highlight density variations, and tooltips reveal detailed information about zip code, species, and breed on hover. Built with Vega-Lite and rendered via the Vega-Lite API, the chart loads data from a CSV file containing Seattle pet license records and automatically fits its size to the browser window.
AI-generated descriptionMIT Licensed



Comments
Sign in to join the discussion.