🌍 Public
Circles on a Map
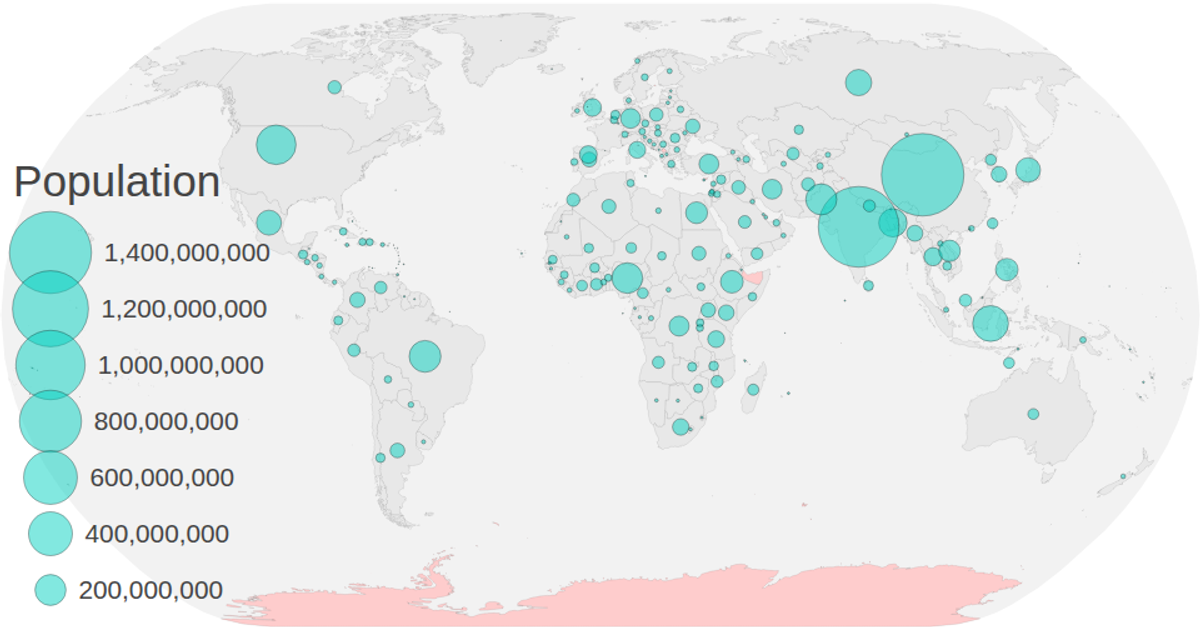
This example displays two choropleth-style encoded variables on a world map. Country polygons are colored green or red based on a 2019 property, while circles sized with a square-root scale represent 2018 population data projected at each country’s centroid. The visualization uses D3 v5’s `geoNaturalEarth1` projection, `geoPath`, and `geoCentroid` to render SVG paths and circles, with TopoJSON from the visionscarto-world-atlas source. A zoom behavior from D3 enables interactive panning and scaling of the entire map group.
AI-generated descriptionMIT Licensed




Comments
Sign in to join the discussion.