🌍 Public
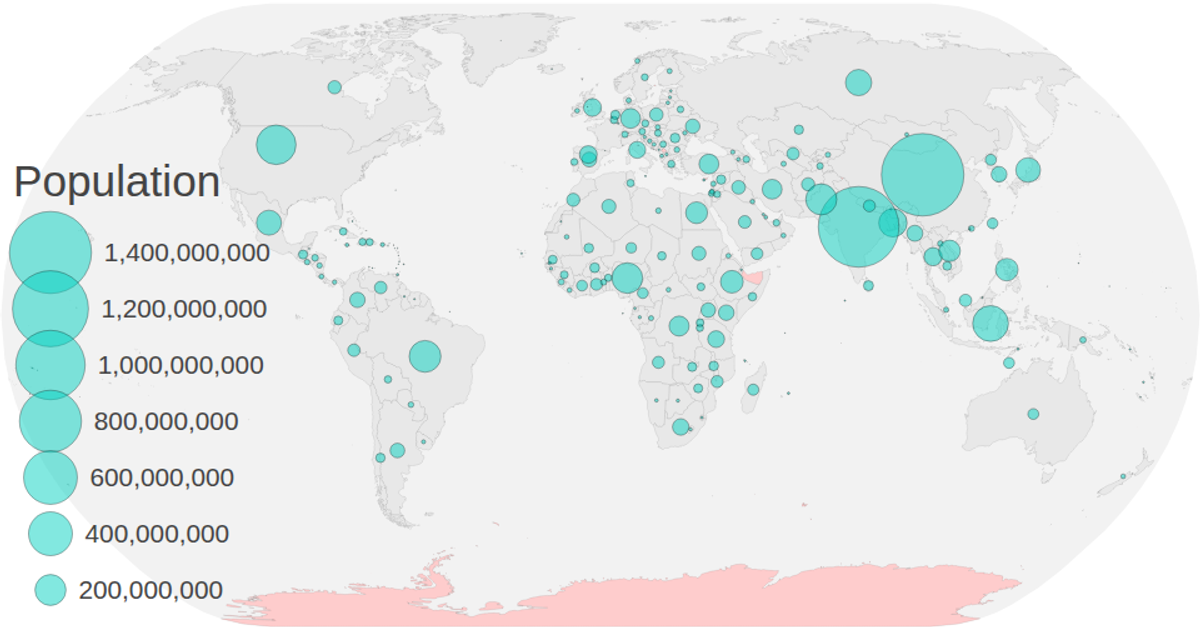
Circles on Map
This example displays a natural Earth choropleth map with circles sized by population, colored by a categorical scale, and overlaid with a clickable legend. It uses TopoJSON world-atlas data and CSV population figures merged by country ID, rendered as SVG paths via `geoPath` and `geoNaturalEarth1`. Users can zoom with `d3.zoom` and filter countries by clicking legend colors, dimming non-matching regions. The code applies `scaleOrdinal` with `schemeSpectral` and projects centroids from geographic coordinates.
AI-generated descriptionTopics Converting an Excel file to CSV Matching identifiers(e.g. "076" vs "76") Handling(and visualizing) missing data Computing and projecting centroids Visualizing population using circles Tweaking styles and interaction
MIT Licensed






Comments
Sign in to join the discussion.