🌍 Public
Line Chart Linear Y Axis
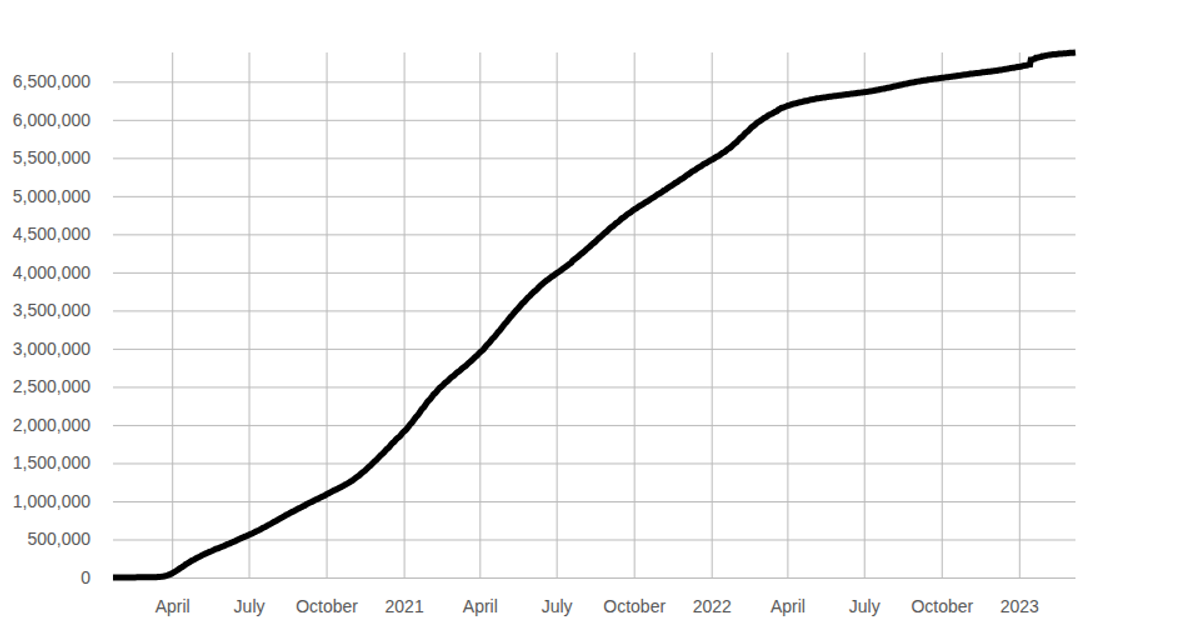
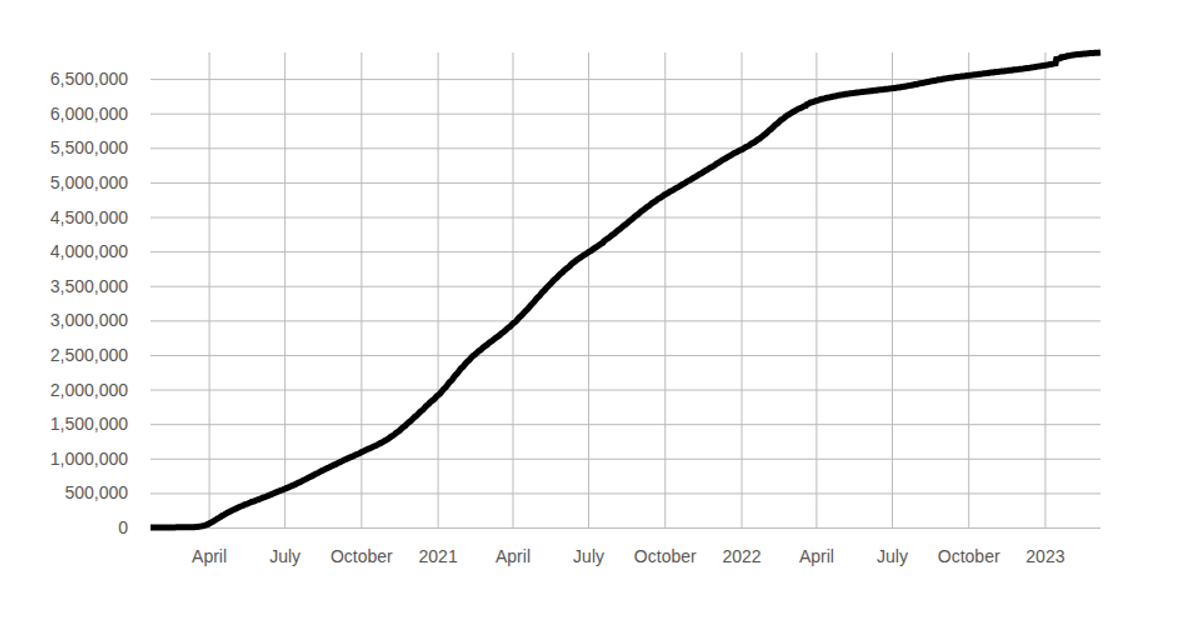
A line chart displays the global cumulative count of COVID-19 deaths over time, with the y-axis scaled linearly from zero to the maximum total. Both the time-based x-axis and linear y-axis are rendered as SVG gridlines using D3 v7’s `axisBottom` and `axisLeft`, while the line is generated with `d3.line`. Interactive hover and marker lines are defined in separate `XMarkerline` and `YMarkerline` components, though they are not called in the main chart. Data comes from raw CSV files loaded via `d3.csv`.
AI-generated descriptionMIT Licensed


Comments
Sign in to join the discussion.