🌍 Public
ICE 7 Area Chart
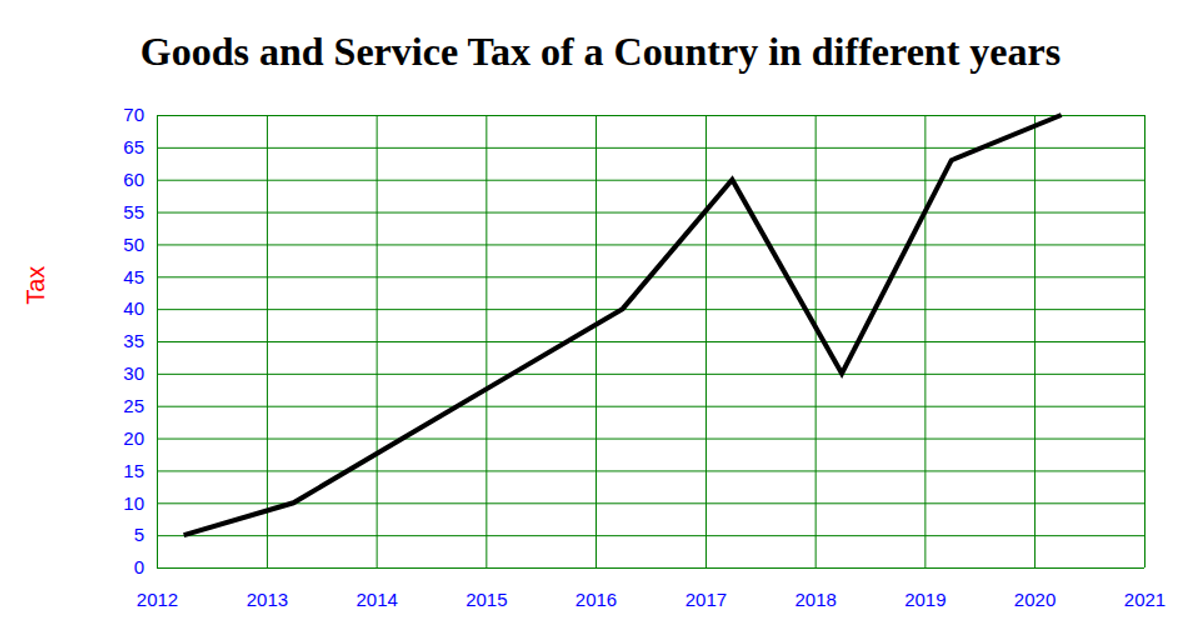
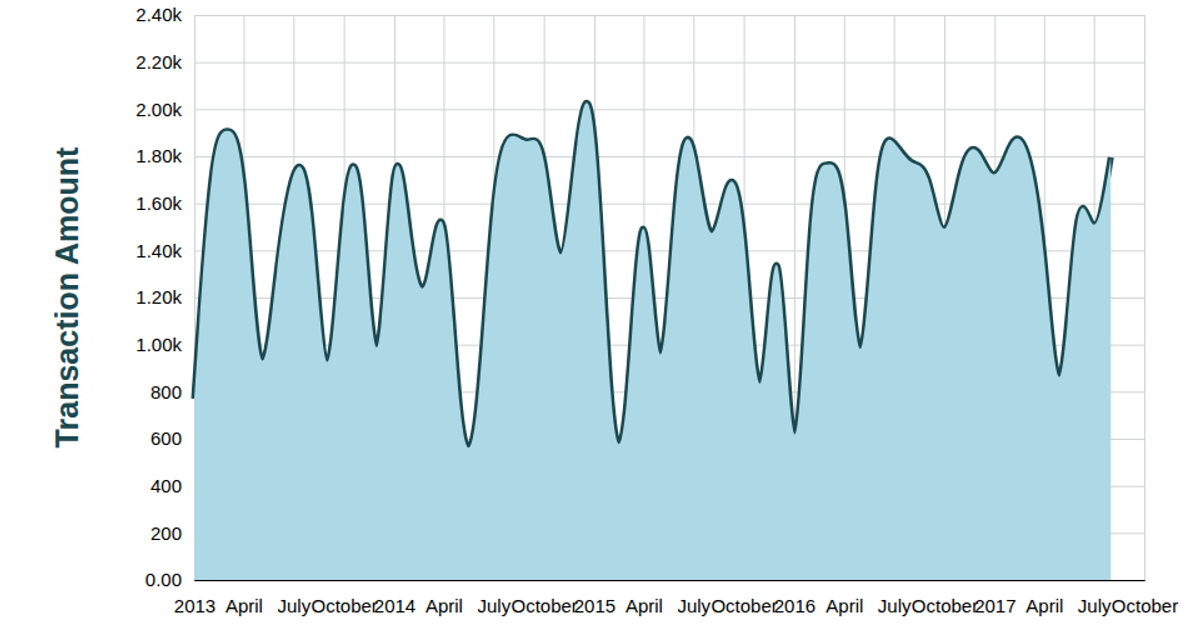
An area chart displays annual Goods and Service Tax values for a country over time, with a smooth curved line and semi-transparent fill highlighting the trend. The visualization loads CSV data from a GitHub gist, parses the tax values as numbers and years as dates, then uses d3.scaleTime and d3.scaleLinear for axes. D3 v5’s area generator with curveBasis draws the filled region, while a line generator adds the stroke. SVG rendering includes custom grid lines, tick labels, and axis labels.
AI-generated descriptionMIT Licensed




Comments
Sign in to join the discussion.