Census Tracts Contours with City Labels
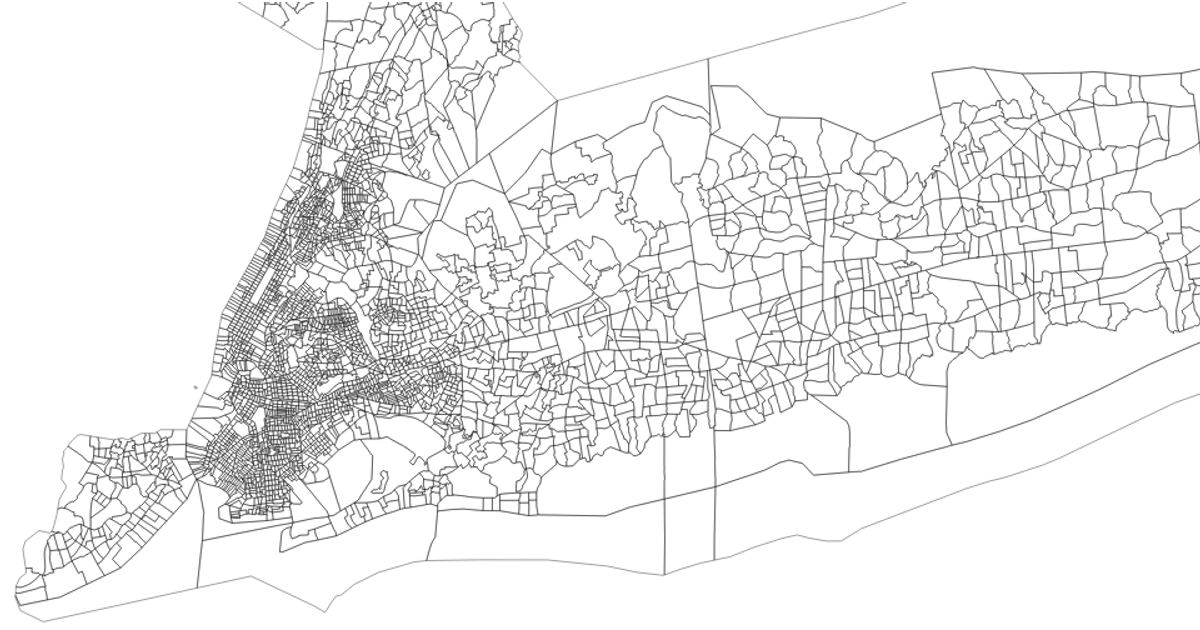
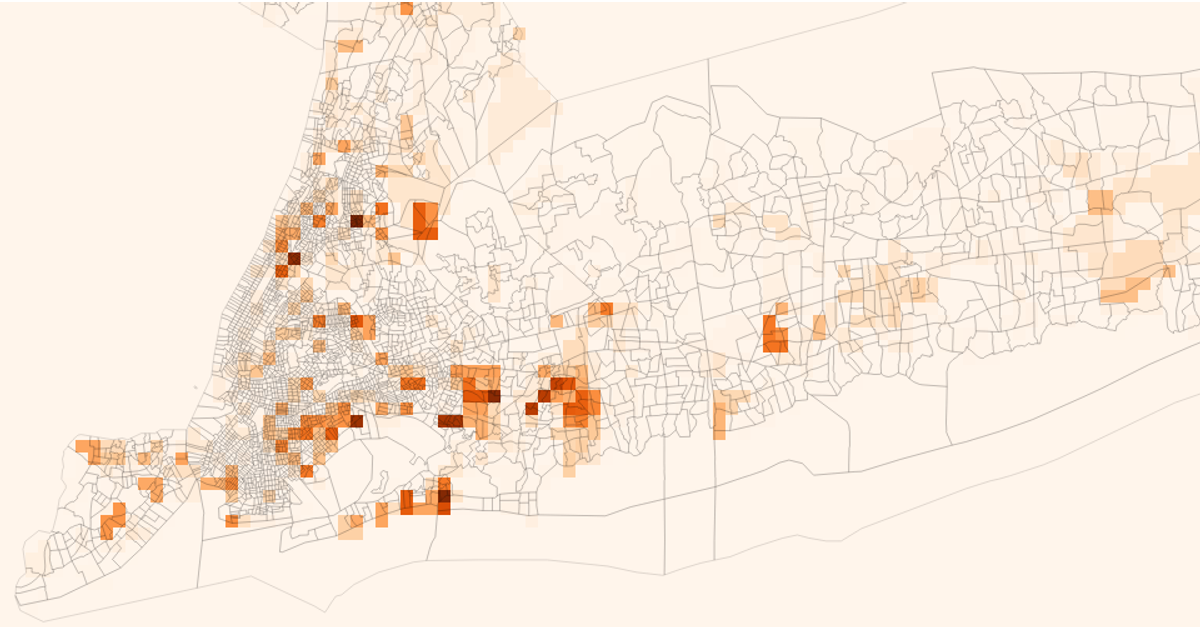
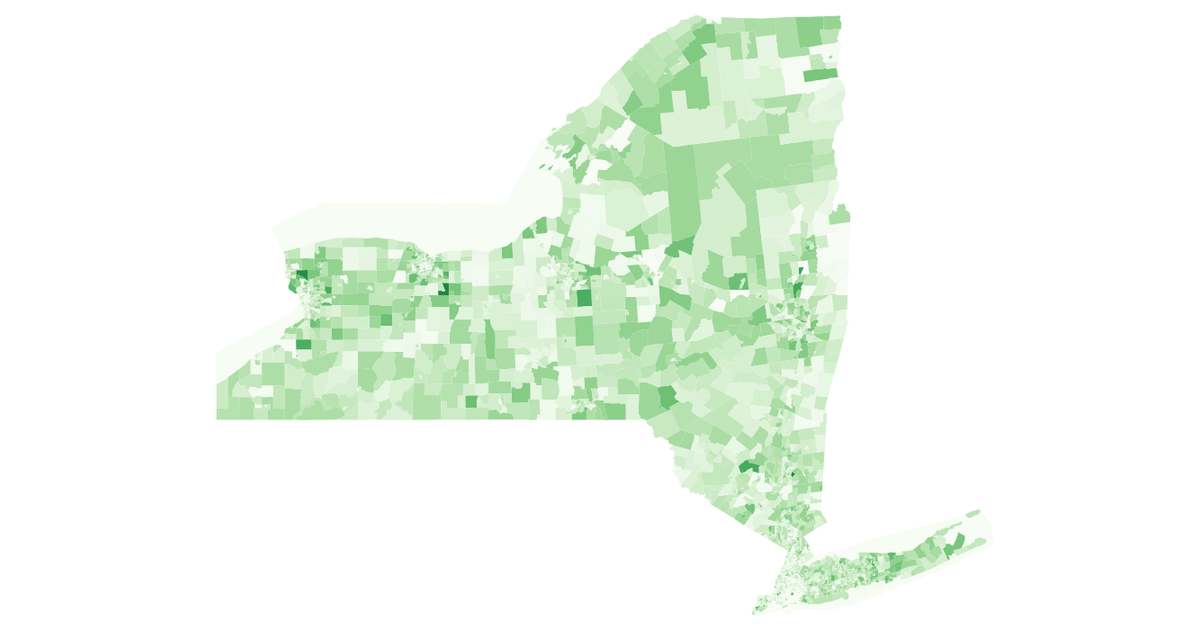
This interactive visualization displays demographic data across New York City census tracts using colored contour layers, with orange representing the Black population and green representing the white population, overlaid with city labels. The code builds a spatial index with RBush, samples data points through turf.booleanPointInPolygon, and uses d3.contours with blur2 smoothing to generate the density regions. Orthographic projection, panning, and zooming are implemented via d3.geoPath, drag, and zoom behaviors. Census tract boundaries and demographic data come from processed government shapefiles and ACS datasets.
AI-generated descriptionData for New York census tracts, downloaded from https://www.census.gov/cgi-bin/geo/shapefiles/index.php?year=2023&layergroup=Census+Tracts and processed using https://mapshaper.org/.
Data resides in Gist: New York City Census Tracts.
See also:



Comments
Sign in to join the discussion.