Prototype of Geo Contours on Census Tracts
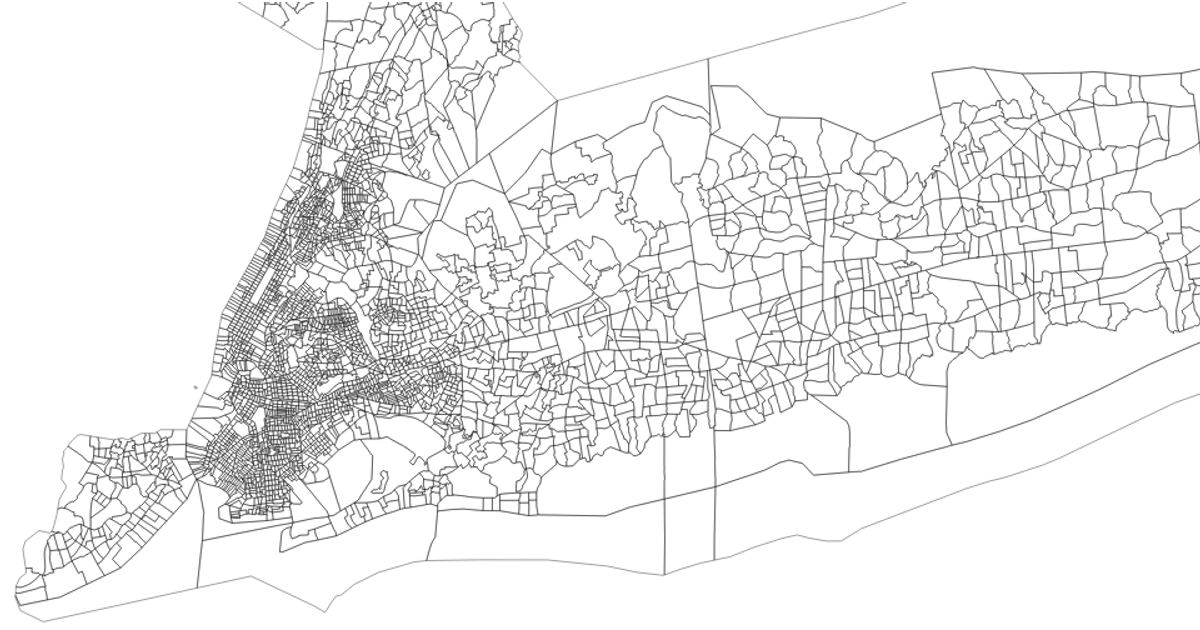
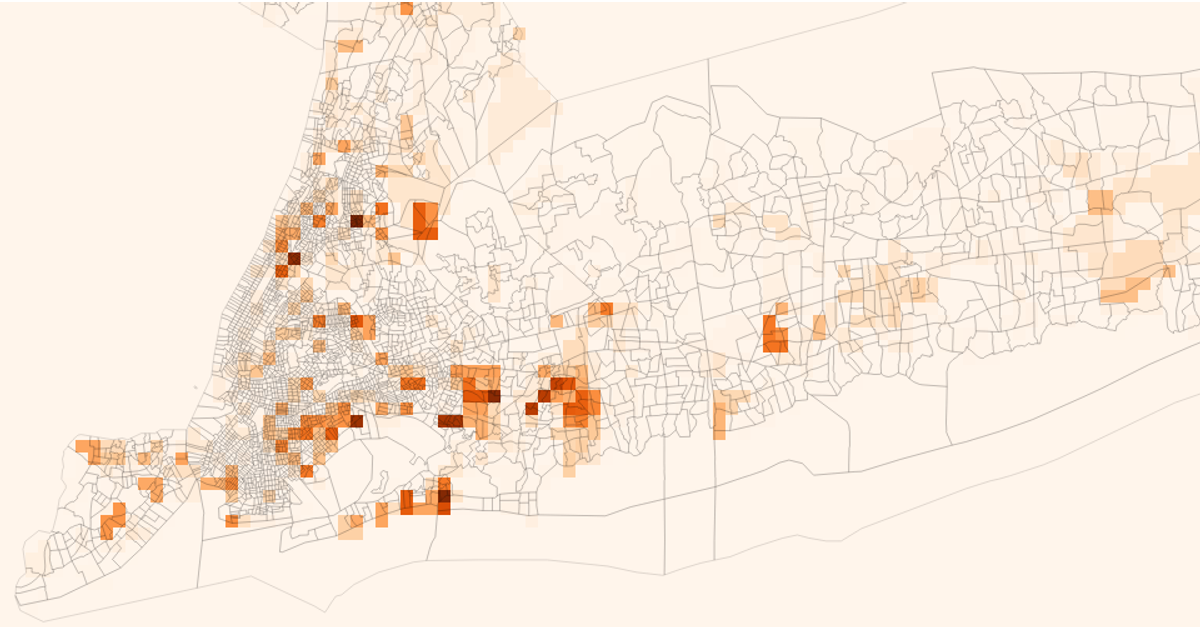
This prototype visualizes demographic distributions across New York City census tracts using geospatial contour lines. It blends overlaid choropleth-style contours colored by race (white, Black, Asian) onto a 3D orthographic projection, with an interactive pan-and-zoom interface. Data comes from the US Census Bureau’s 2023 Tracts shapefile and ACS estimates. The code uses `d3.geoOrthographic`, `d3.geoPath`, `d3.contours`, `@turf/turf` for point-in-polygon tests, and `RBush` for spatial indexing of tract boundaries.
AI-generated descriptionData for New York census tracts, downloaded from https://www.census.gov/cgi-bin/geo/shapefiles/index.php?year=2023&layergroup=Census+Tracts and processed using https://mapshaper.org/.
Data resides in Gist: New York City Census Tracts.
See also:



Comments
Sign in to join the discussion.