🌍 Public
legend date
EEnes Gök
Last edited Dec 2, 2021
Created on Dec 2, 2021
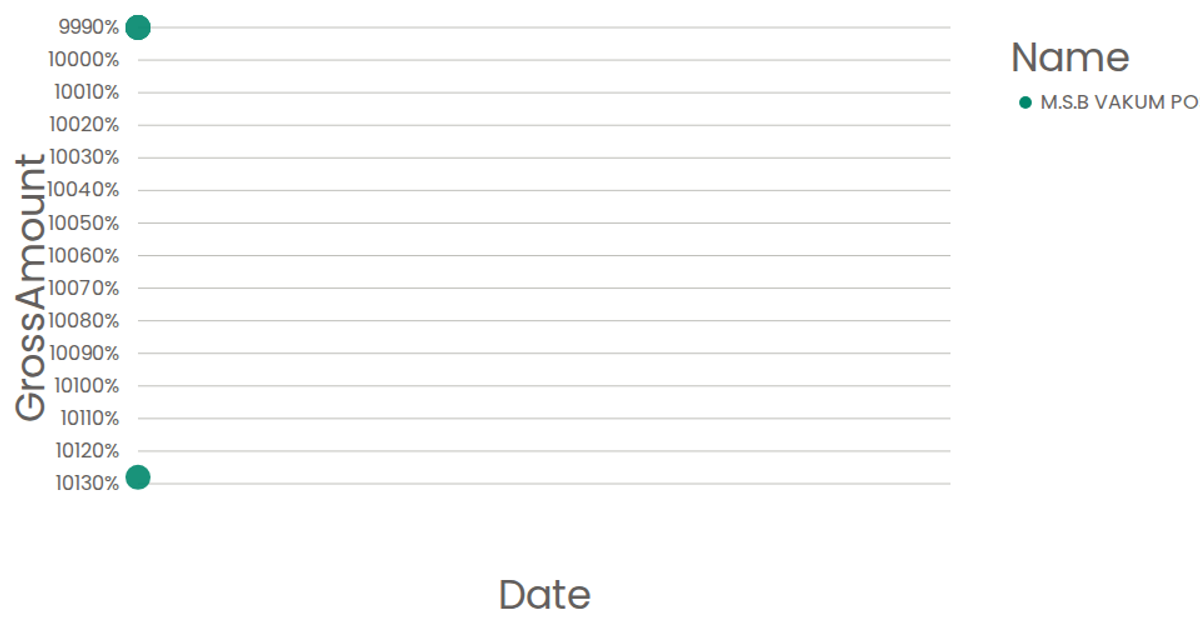
This scatterplot displays daily GrossAmount values over time, with each point colored by its price category through a categorical ordinal scale. The visualization includes an interactive color legend that highlights points matching the hovered value while fading others. Built with React and D3 v6, it uses `scaleTime`, `scaleLinear`, and `scaleOrdinal` to map date, price, and color encodings, rendering circles as SVG marks. Data comes from NOAA, loaded via `d3.csv`, with axes generated by custom `AxisBottom` and `AxisLeft` components.
AI-generated descriptionThis data was requested and collected from the NOAA.
Created using D3 and js, this time with a menu for the y axis.
MIT Licensed


Comments
Sign in to join the discussion.