🌍 Public
Activity 9 q2
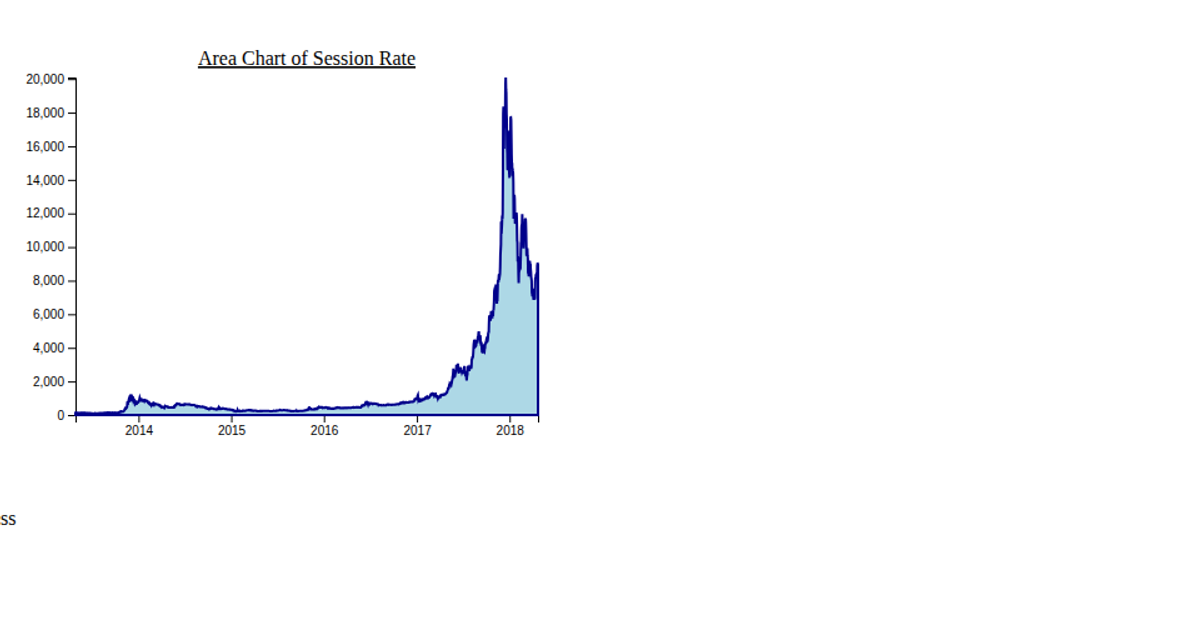
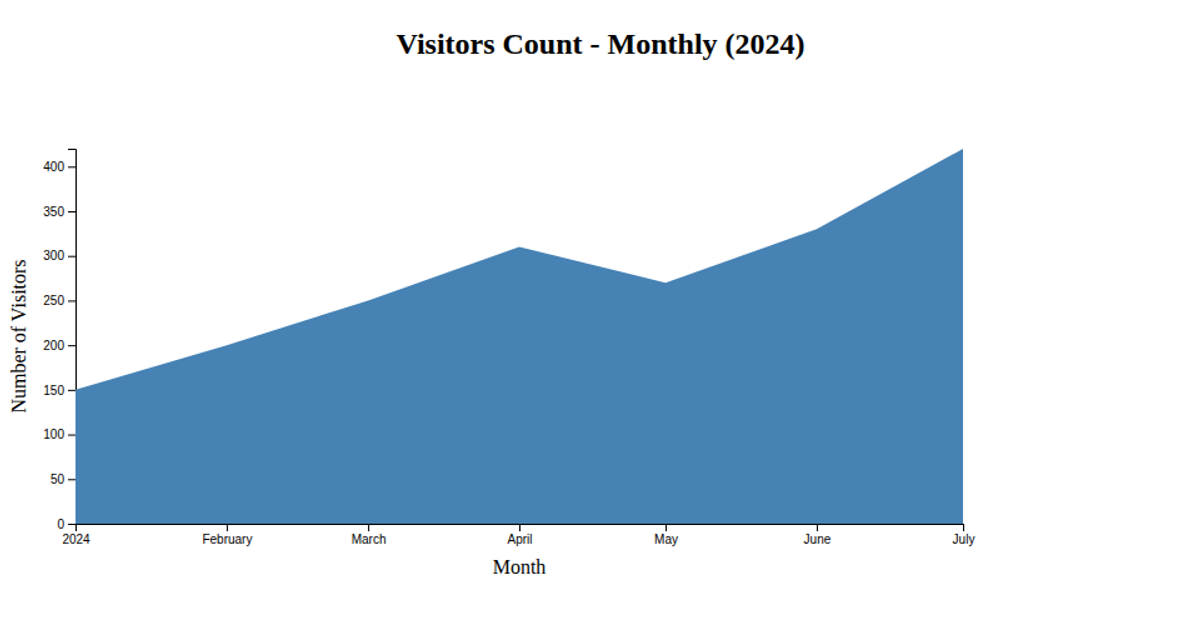
This area chart displays the exchange rate of USD over time, using a green filled area to emphasize the trend. The visualization is rendered as an SVG and built with D3 v7, which handles data parsing, time-based scaling on the x-axis, and linear scaling on the y-axis. The chart also includes labeled axes for "Year" and "USD", with the area path generated by `d3.area()`. The data is loaded from a remote CSV file, and the chart is styled with a green fill and black stroke.
AI-generated descriptionMIT Licensed





Comments
Sign in to join the discussion.