🌍 Public
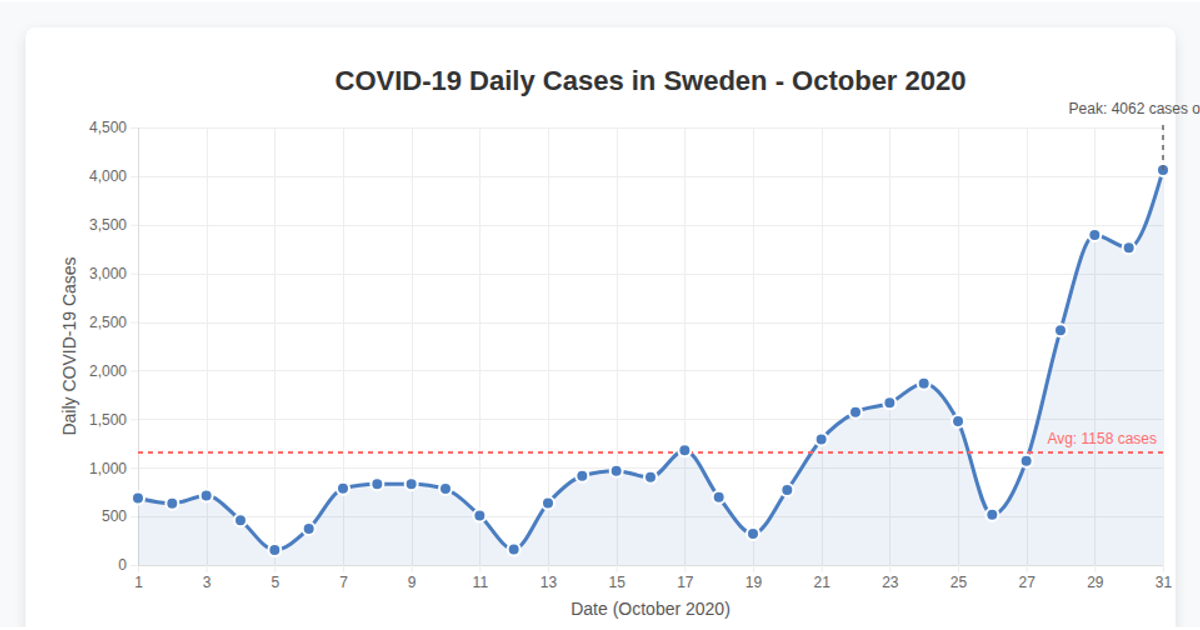
Covid Casualties in Sweden Jan-Oct 2020
Kkfhujosefsson@dons.usfca.edu
Last edited Apr 12, 2025
Created on Feb 9, 2025
A bar chart displays COVID-19 casualties in Sweden from January to October 2020. The p5.js sketch loads a CSV file from a GitHub gist and aggregates deaths by month. Using the Canvas API, it draws axes, gridlines, and rectangular bars, with labels for each month and the number of casualties. Plotly is loaded but not used in the visualization.
AI-generated descriptionMIT Licensed




Comments
Sign in to join the discussion.