🌍 Public
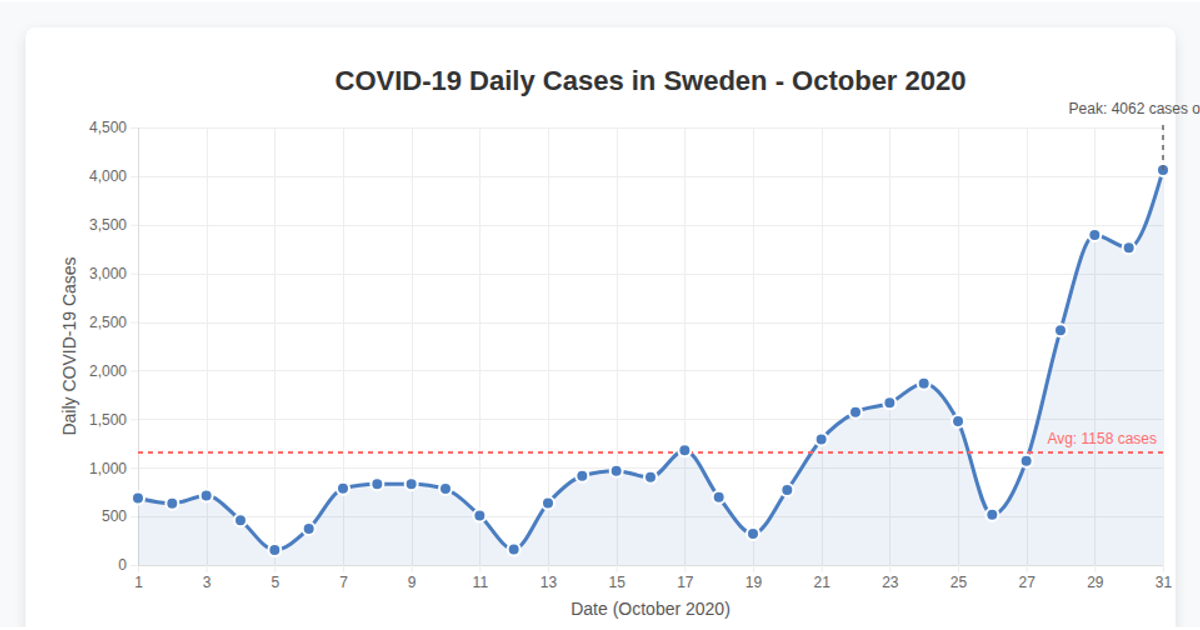
Fork of Line Chart - Covid Cases per day in Sweden October 2020
Kkfhujosefsson@dons.usfca.edu
Last edited Apr 23, 2025
Created on Apr 12, 2025
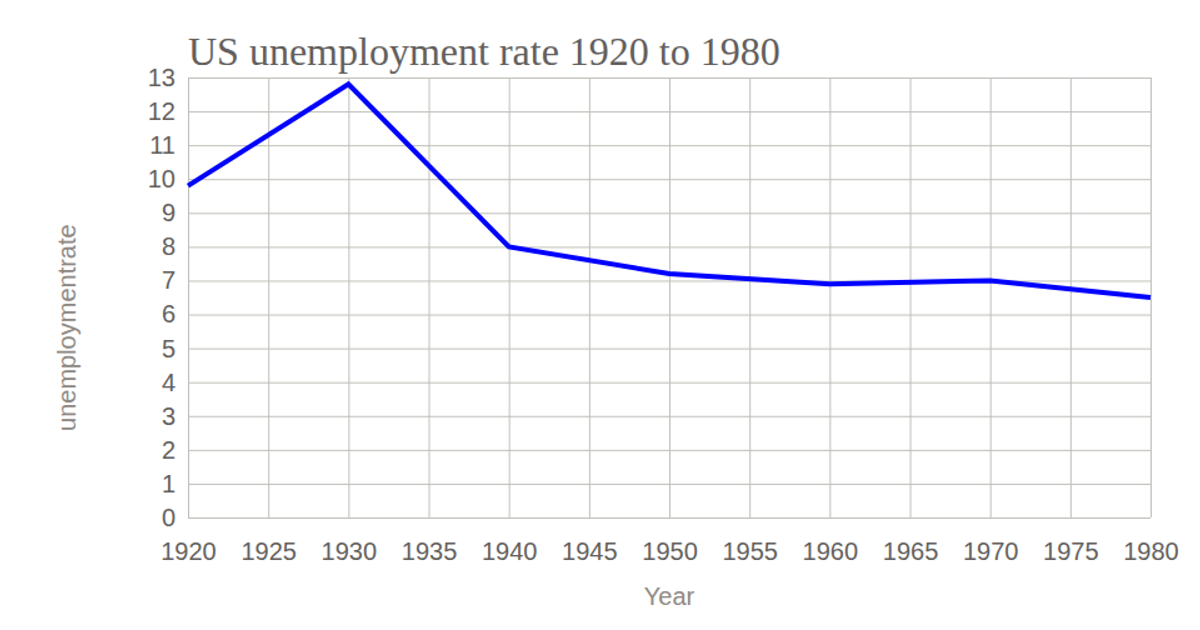
This line chart visualizes the global unemployment rate trend from 1991 to 2023, using yearly averages calculated from raw data loaded via `d3.csv` from a Gist URL. The chart displays a smooth monotone curve (`d3.curveMonotoneX`) in steelblue, with an x-axis for years and a y-axis labeled with percentages. The implementation uses `d3.scaleLinear` for both axes, `d3.axisBottom` and `d3.axisLeft` for tick marks, and `d3.group` with `d3.mean` to aggregate monthly rates by year. The SVG rendering is responsive, with the chart width adapting to the viewport.
AI-generated descriptionMIT Licensed



Comments
Sign in to join the discussion.