🌍 Public
Baby's first bar chart
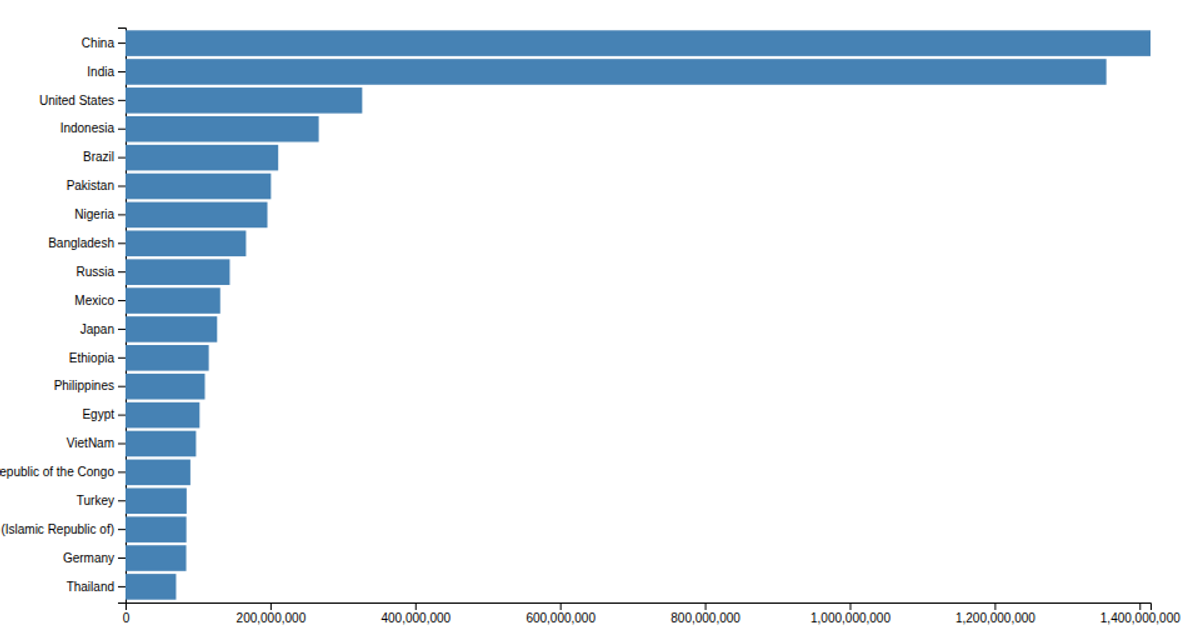
This example shows a horizontal bar chart of the world’s most populous countries, scaled from a CSV file so that population values are displayed in thousands. It uses D3 v5’s `scaleLinear`, `scaleBand`, `axisLeft`, and `axisBottom` to position bars and axes, with SVG `rectangles` styled in steel blue. The data is loaded via `d3.csv` and multiplied by a constant, while margins are applied to an inner chart group for readable labels and a clean layout.
AI-generated descriptionTutorial.
MIT Licensed


Comments
Sign in to join the discussion.