🌍 Public
Chloropleth Map - Interactive
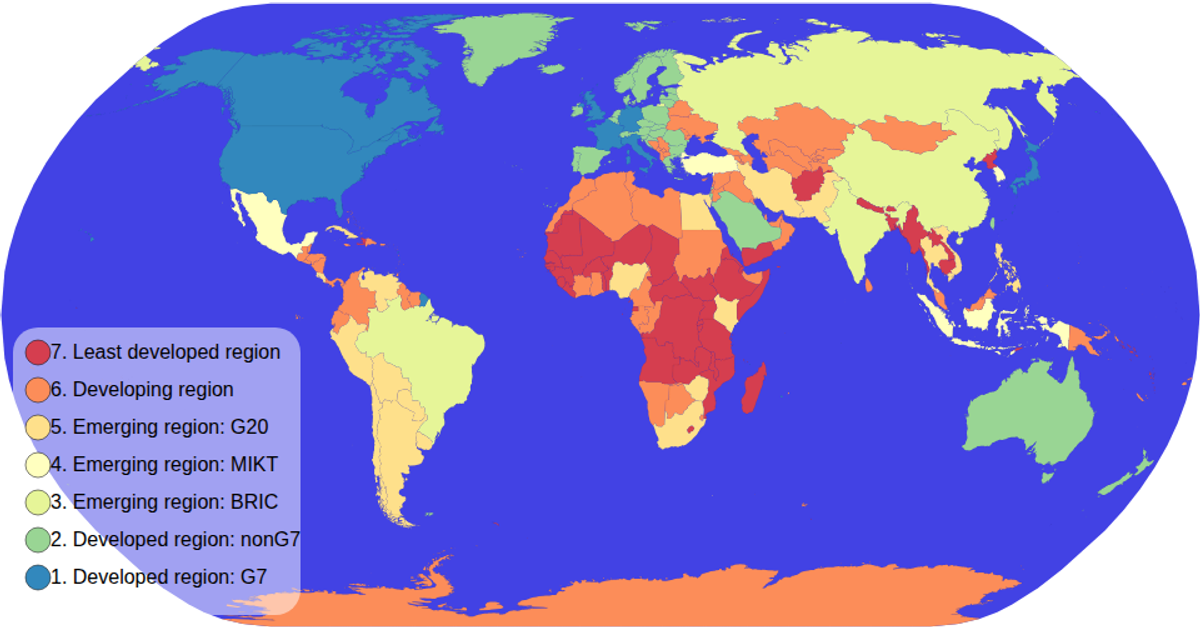
This interactive chloropleth map displays global economic data by country, with a color legend that filters the map to highlight selected categories. The visualization uses D3 v5’s `geoPath` and `geoNaturalEarth1` projections to render the world map, while the legend leverages `scaleOrdinal` and `schemeSpectral` for color mapping. Users can click legend ticks to isolate specific economic classifications, with non-selected countries dimmed and the selected category emphasized. The map also supports zooming via D3’s `zoom` event, and country data is loaded from the world-atlas TopoJSON and TSV sources.
AI-generated descriptionAbout chloropleth map interactive filtering - see video
MIT Licensed





Comments
Sign in to join the discussion.