🌍 Public
Chloropleth Map
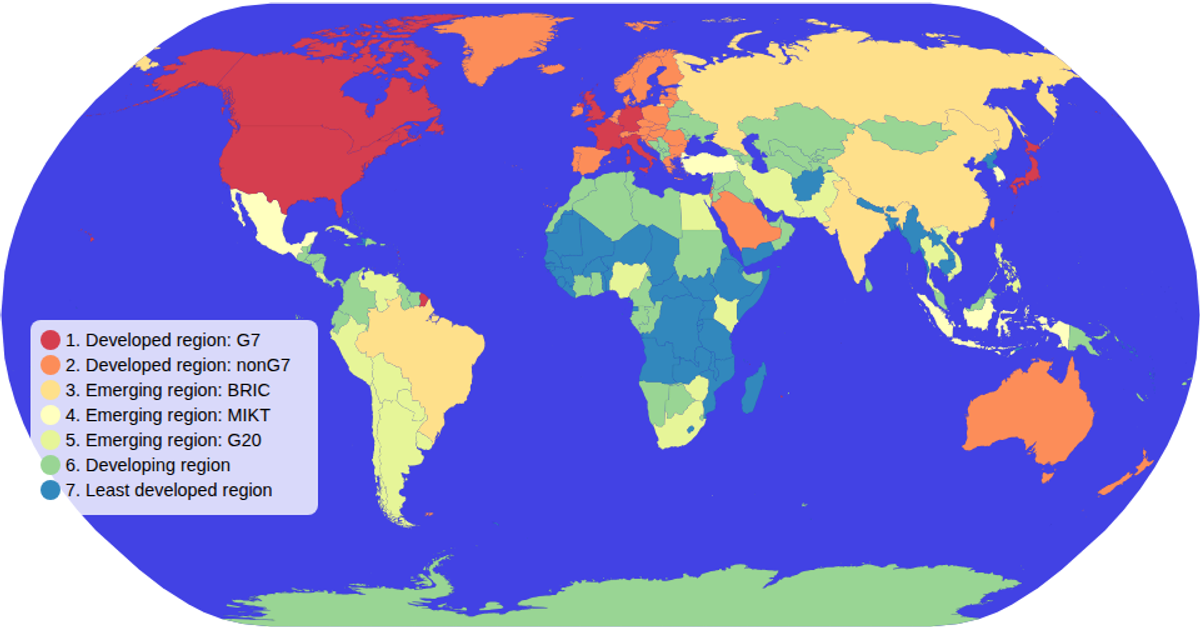
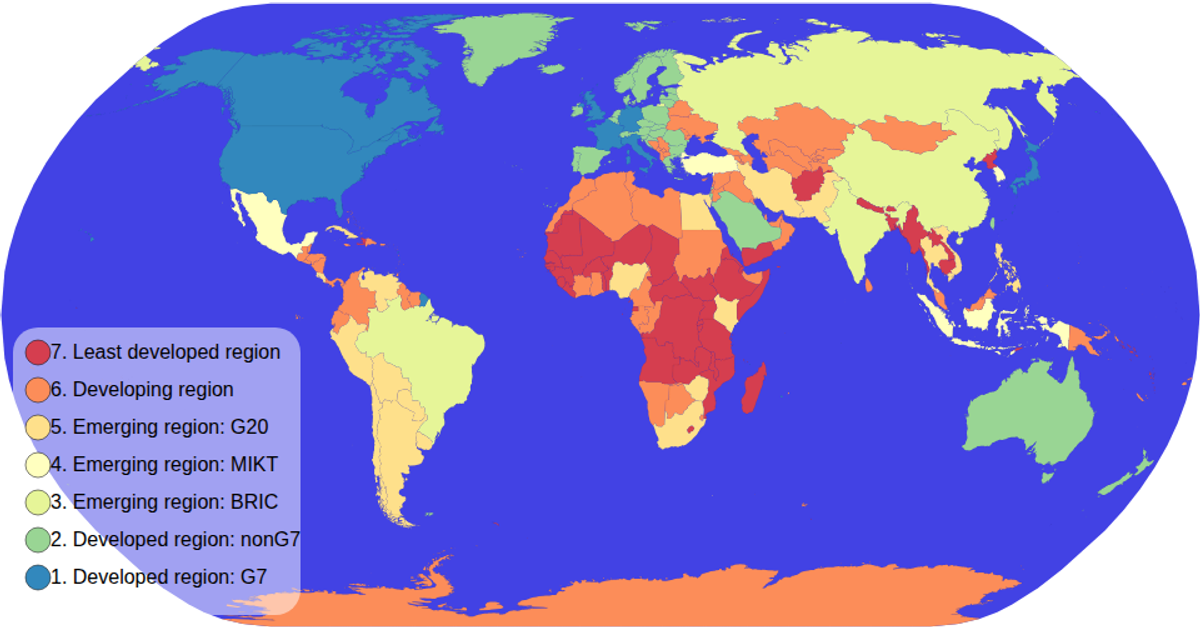
This choropleth map visualizes global economic classifications by coloring each country according to its economy type, with a color legend to the side. Built with D3 v5, it uses `d3.geoPath` with the Natural Earth projection to render country boundaries from TopoJSON data loaded from the world-atlas package. An ordinal color scale maps economic categories to the spectral scheme, while zoom interaction and hover highlighting are implemented via `d3.zoom` and CSS. The legend is generated as a reusable SVG component through custom functions.
AI-generated descriptionMIT Licensed



Comments
Sign in to join the discussion.