🌍 Public
d3 Test visualization with scatterplot
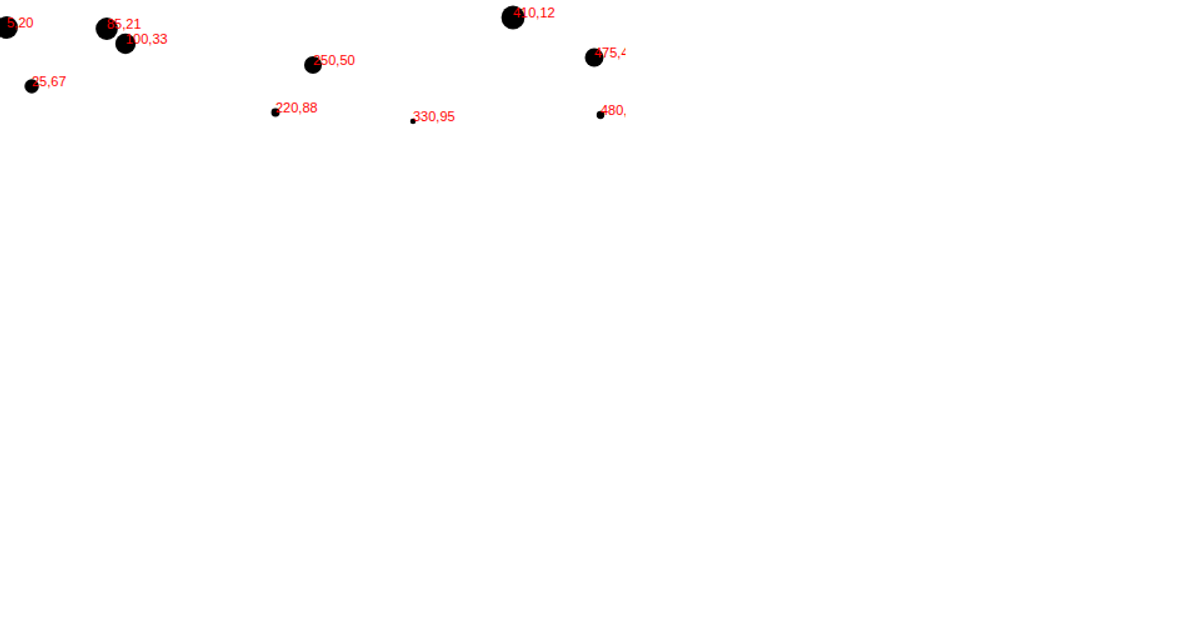
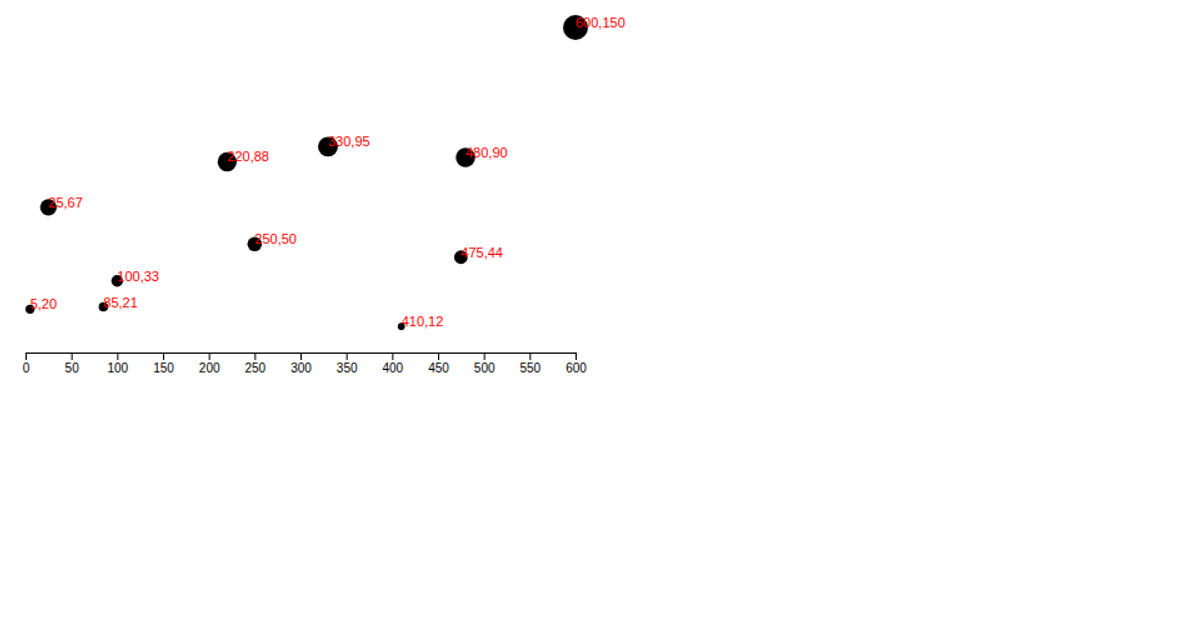
This d3.v5 scatterplot renders red, semi-transparent circles on a large SVG canvas, with axis labels, tick marks, and a title styled via CSS. The chart uses `d3.axisBottom` and `d3.axisLeft` to generate the axes, and the data is hard-coded in the JavaScript file, plotted via `d3.selectAll` and `d3.attr` for positioning. The visualization emphasizes simplicity, with all marks sharing a uniform color and opacity.
AI-generated descriptionMIT Licensed




Comments
Sign in to join the discussion.