🌍 Public
ICE-7 Scatter plot
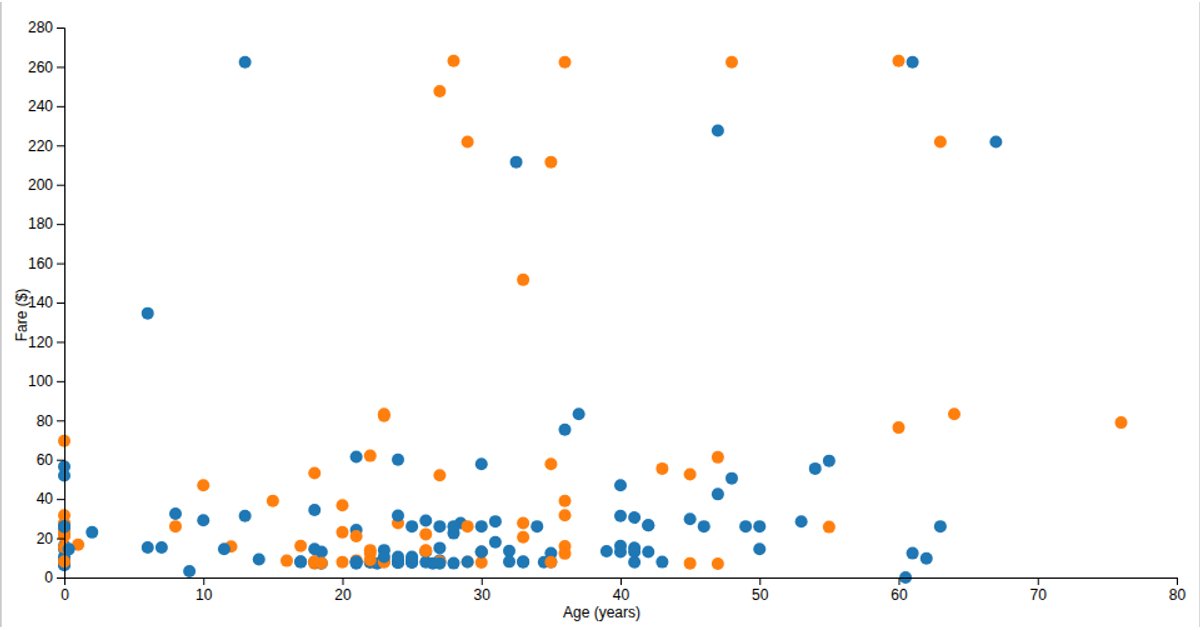
This scatter plot visualizes the relationship between high and low confidence limits in an Alzheimer’s health dataset, with each point colored by stratification group via a categorical scale. Using D3.js, it employs linear scales for axes, ordinal color mapping, and SVG circles to encode the data. The chart is rendered responsively to fill the viewport, with axes labeled through D3’s axis components. Data is loaded from a remote CSV, and the reusable chart pattern allows dynamic configuration of dimensions, margins, and accessor functions.
AI-generated descriptionA reusable scatter plot inspired by Towards Reusable Charts.
MIT Licensed






Comments
Sign in to join the discussion.