🌍 Public
Fork of ICE-6: Rendering Marks and Channels with React & D3
SSampras Dsouza
Last edited Jul 5, 2022
Created on Jul 5, 2022
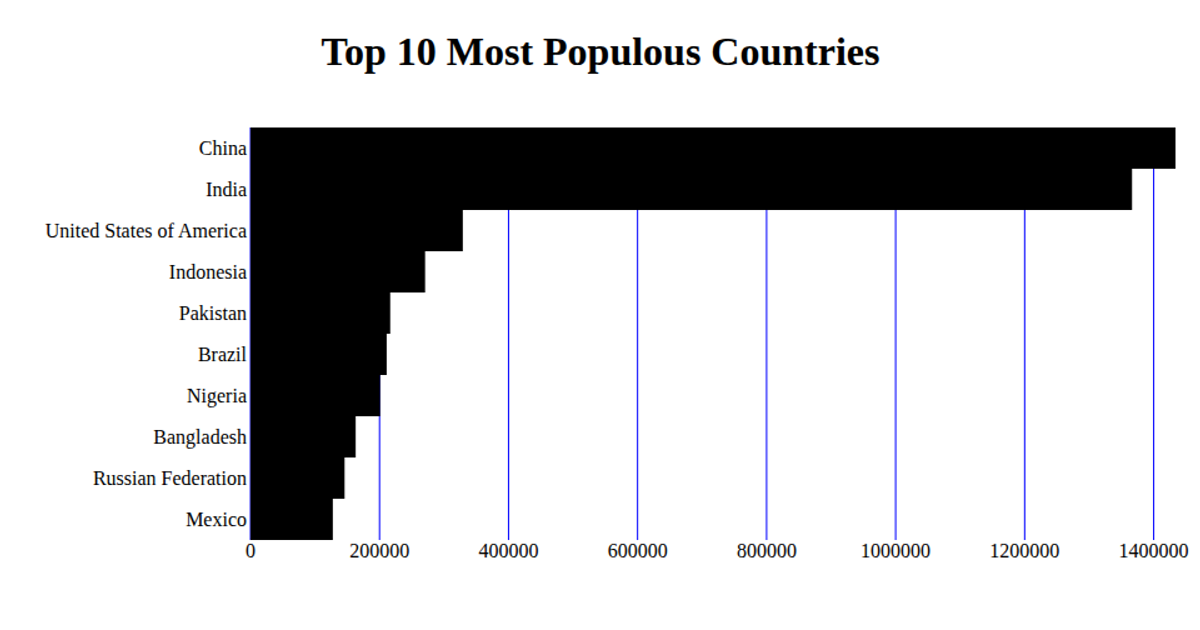
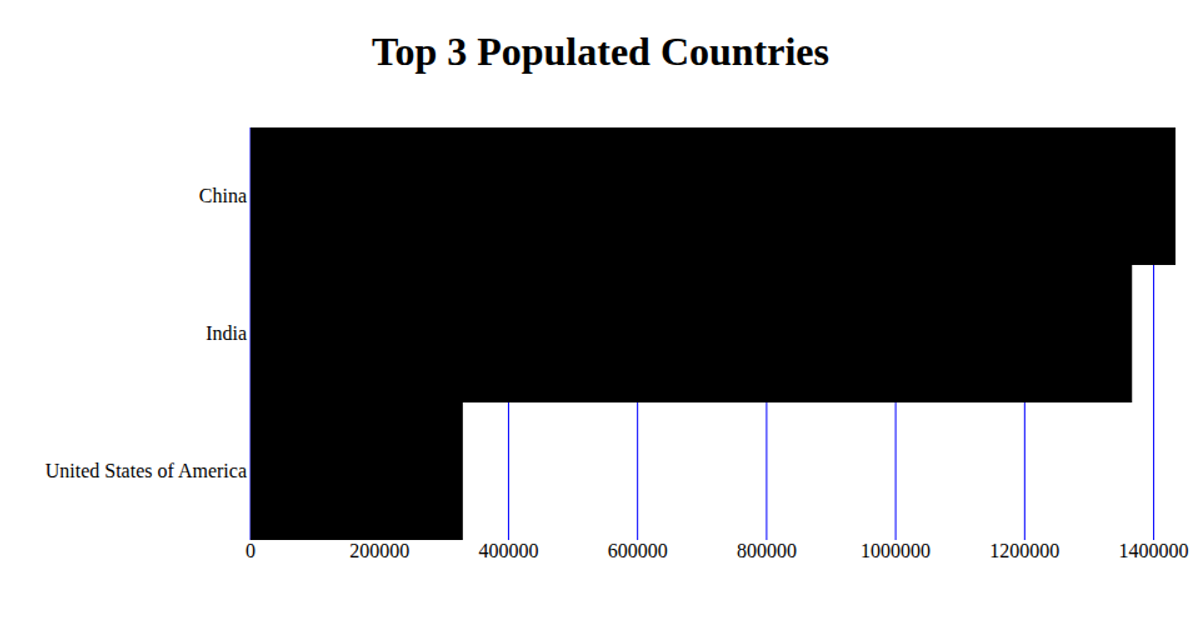
This example shows a bar chart of sample categorical data, with bars colored in teal, alongside an unfinished bar chart template for top 10 most populous countries using React and D3. The visualization uses React hooks like `useState` and `useEffect` to manage data loading and window resize events, while D3 scales (`d3.scaleBand`, `d3.scaleLinear`) and axes (`d3.axisBottom`, `d3.axisLeft`) render the SVG marks in the `lineChart.js` component. Data for the country chart is fetched via `d3.csv` from a GitHub gist, though only the sample chart renders visible output.
AI-generated descriptionA bare minimum HTML page demonstrating use of CSS and JavaScript.
See also React Starter.
MIT Licensed





Comments
Sign in to join the discussion.