🌍 Public
Cheap Tricks for Interation
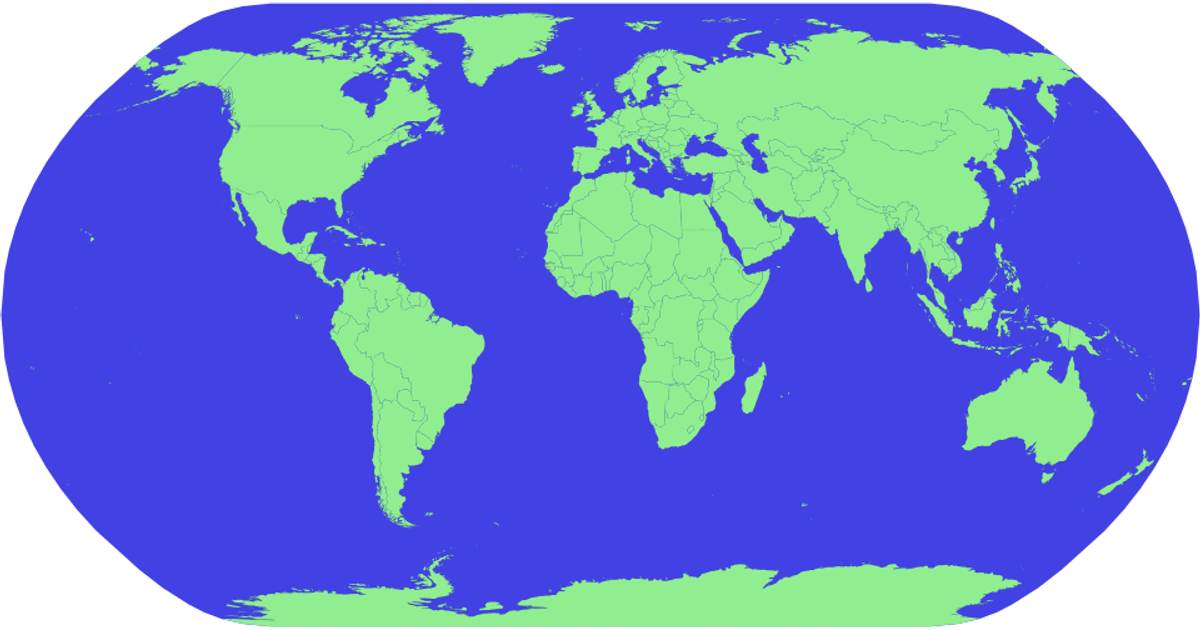
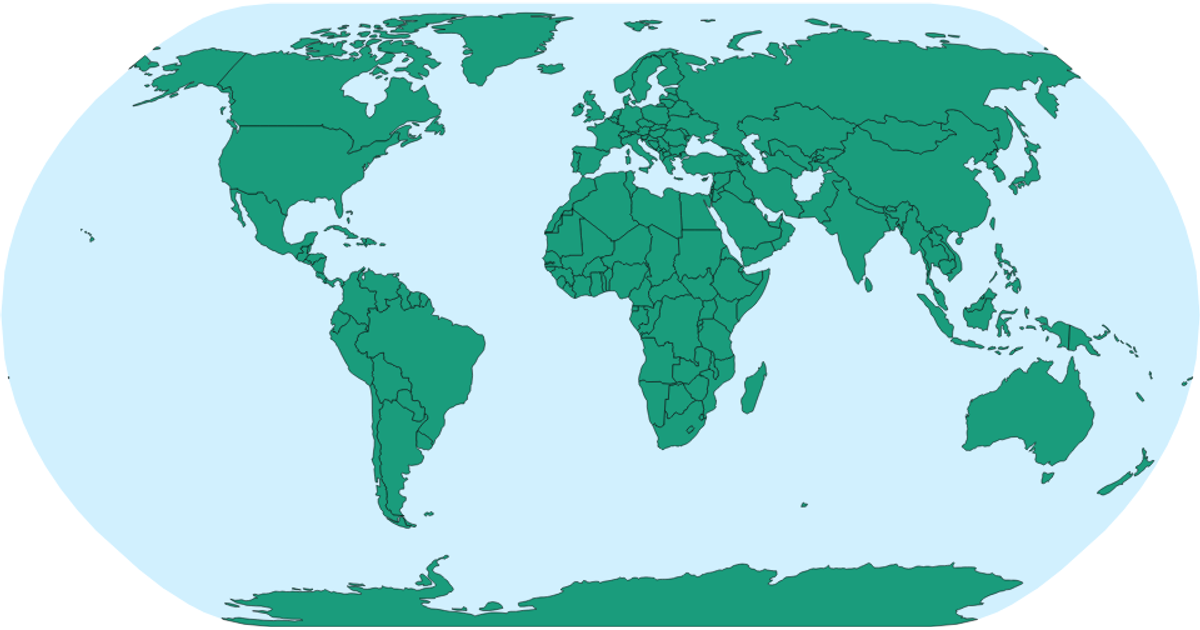
This example shows a zoomable world map colored by country, with each country’s name appearing as a tooltip on hover. The visualization uses d3.zoom to enable pan and zoom transformations on the SVG group, while d3.geoPath with a geoNaturalEarth1 projection renders the geographic outlines. Country boundaries come from the world-atlas TopoJSON dataset, with names matched via TSV data. Hovering highlights a country in red via CSS, and d3.append adds title elements for the tooltips.
AI-generated descriptionMIT Licensed





Comments
Sign in to join the discussion.