🌍 Public
Let's make a map
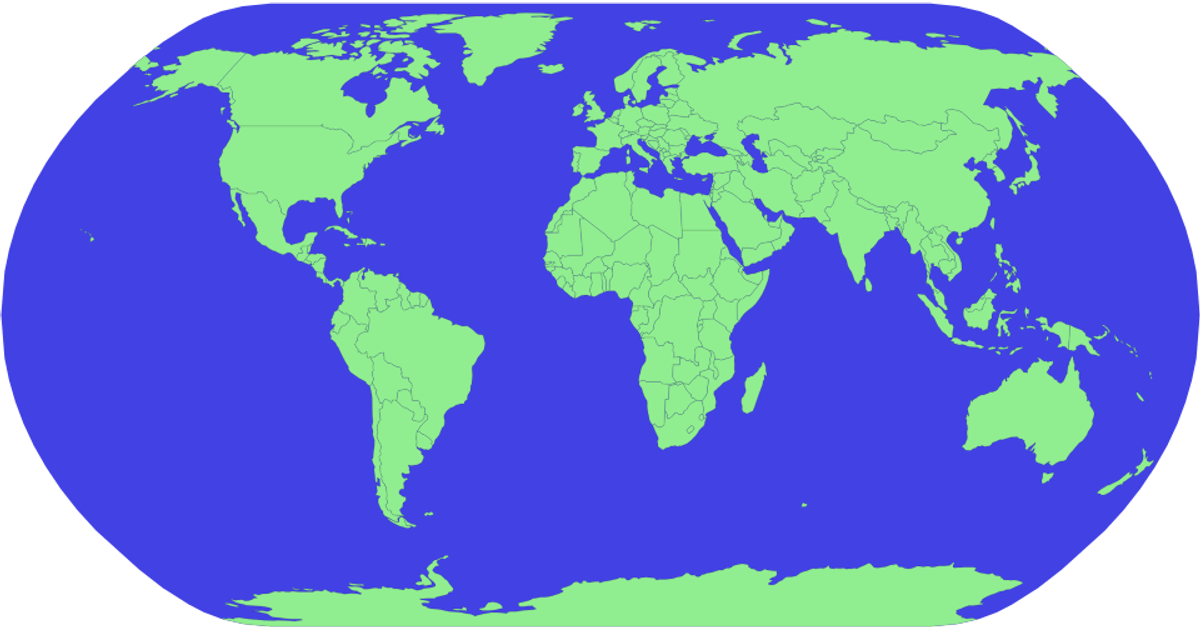
This example visualizes the nominal GDP of ten countries from a CSV dataset on a natural Earth projection map. The map first draws a blue sphere backdrop using `d3.geoNaturalEarth1` and `d3.geoPath`, then overlays country outlines in light green from the world-atlas TopoJSON file. Countries are rendered as SVG paths using the `feature` method from topojson, with GDP values not yet linked to any visual encoding.
AI-generated descriptionMIT Licensed


Comments
Sign in to join the discussion.