🌍 Public
D3 Choropleth Map
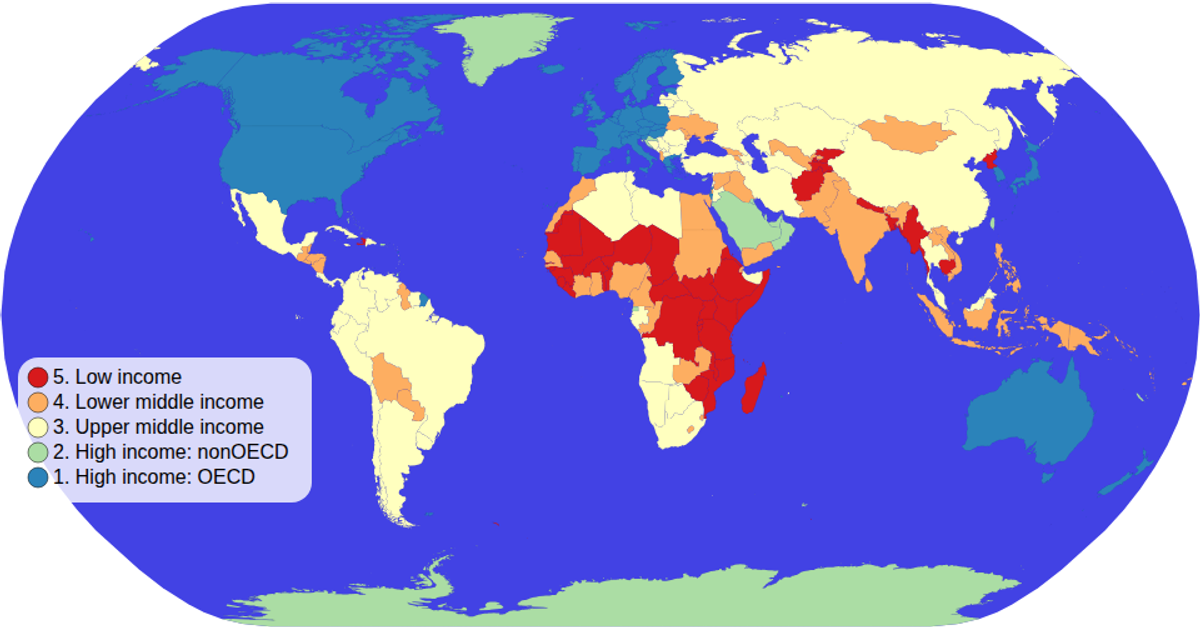
This D3 Choropleth Map visualizes countries colored by income group using a natural Earth projection and world atlas TopoJSON data. The map uses an ordinal color scale with a spectral scheme, while a semi-transparent legend with circles and text labels displays the income categories. Hovering highlights countries in black and reveals tooltips showing both country name and economy type. The visualization supports zooming and panning through d3.zoom, with the map rendered as SVG paths generated by d3.geoPath.
AI-generated description- Integrating TopoJSON with tabular data
- Creating a loadAndProcessData module
- Visualizing an ordered attribute with color
- Showing data from 2 attributes in tooltip
- Adding a color legend
MIT Licensed




Comments
Sign in to join the discussion.