🌍 Public
Some Practice JS
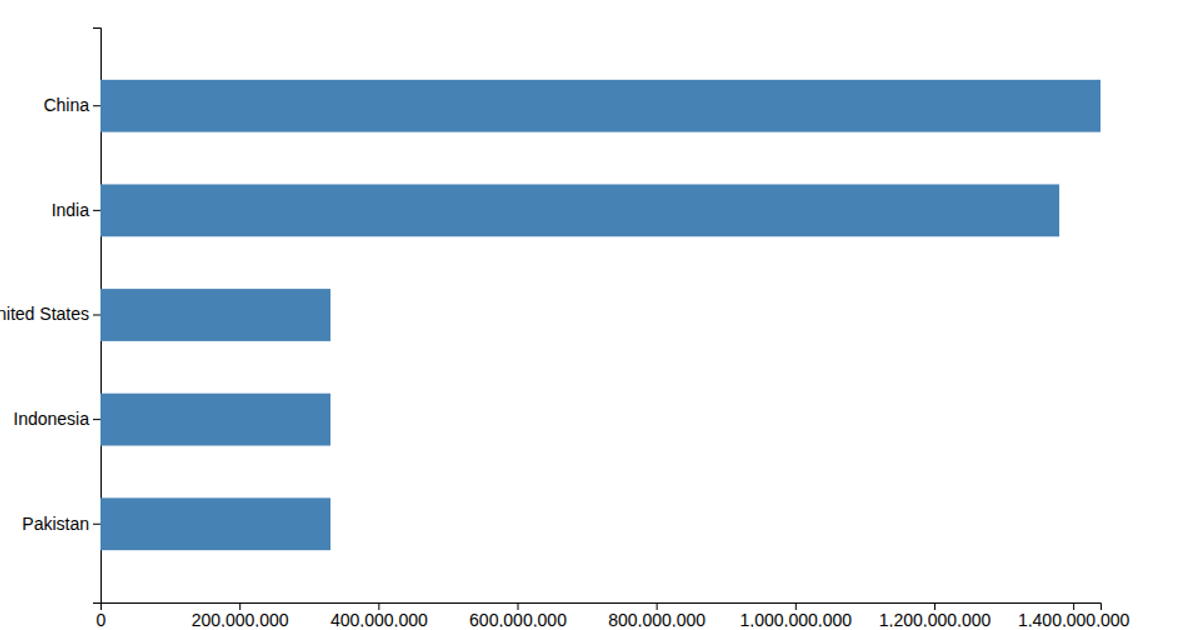
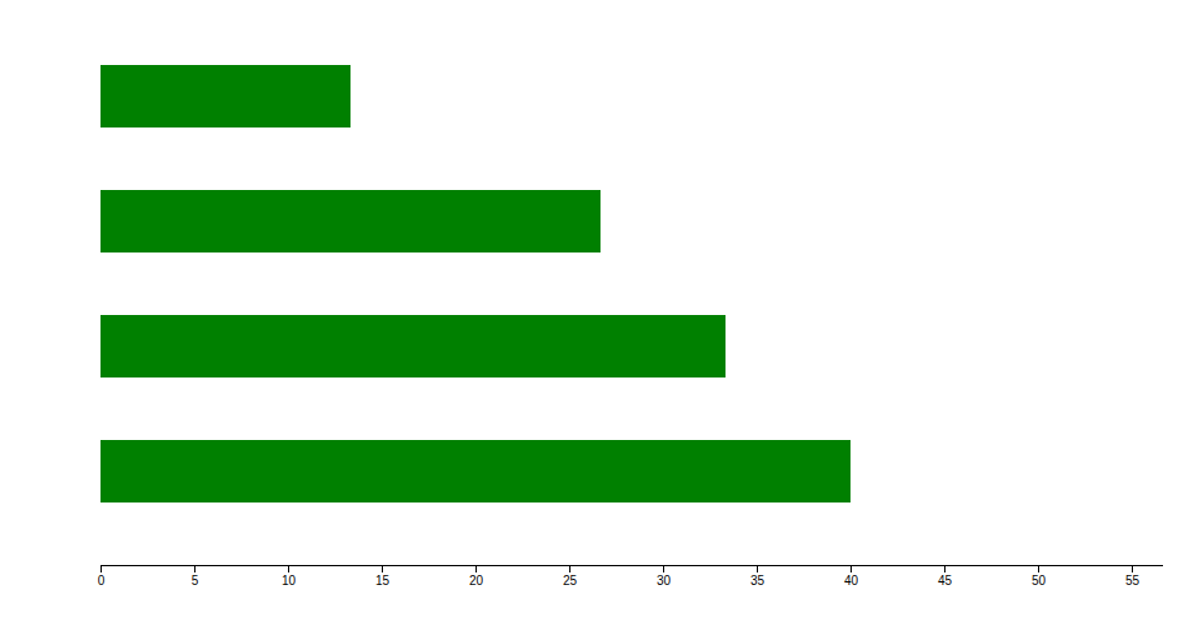
A simple bar chart displays four dummy data points, comparing values across regions (USA, India, China, Germany). The visualization renders as SVG rectangles using D3 version 6, with `d3.scaleBand` for the categorical x-axis and `d3.scaleLinear` for the numeric y-axis. The chart's purple bars are generated through D3's selection API, appending `rect` elements with computed width, height, and position attributes from the scales. The example comes from a practical introduction to D3.js, demonstrating fundamental data binding and scale usage.
AI-generated descriptionSome D3 practice sourced from D3.js - A Practical Introduction as well as some Observable pages.
MIT Licensed





Comments
Sign in to join the discussion.