🌍 Public
Untitled
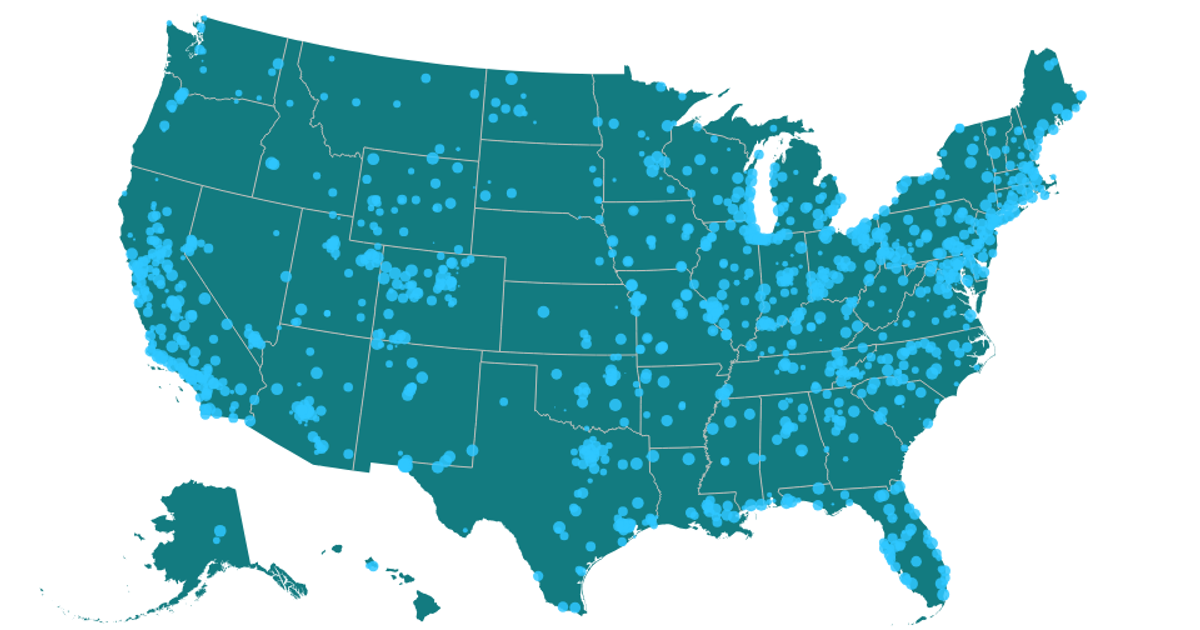
This example combines a U.S. state map with a date-based histogram, visualizing ozone AQI values from a cleaned CSV dataset. The map renders state boundaries and interiors using `d3.geoPath` and `topojson` features. A histogram of daily AQI readings is drawn with React and D3 scales, where each bar’s tooltip displays its exact AQI value. The code uses `d3.csv` for data loading and `d3.json` for the US Atlas topology, with styling provided by Poppins font and custom CSS.
AI-generated descriptionMIT Licensed


Comments
Sign in to join the discussion.