🌍 Public
Circles on a map
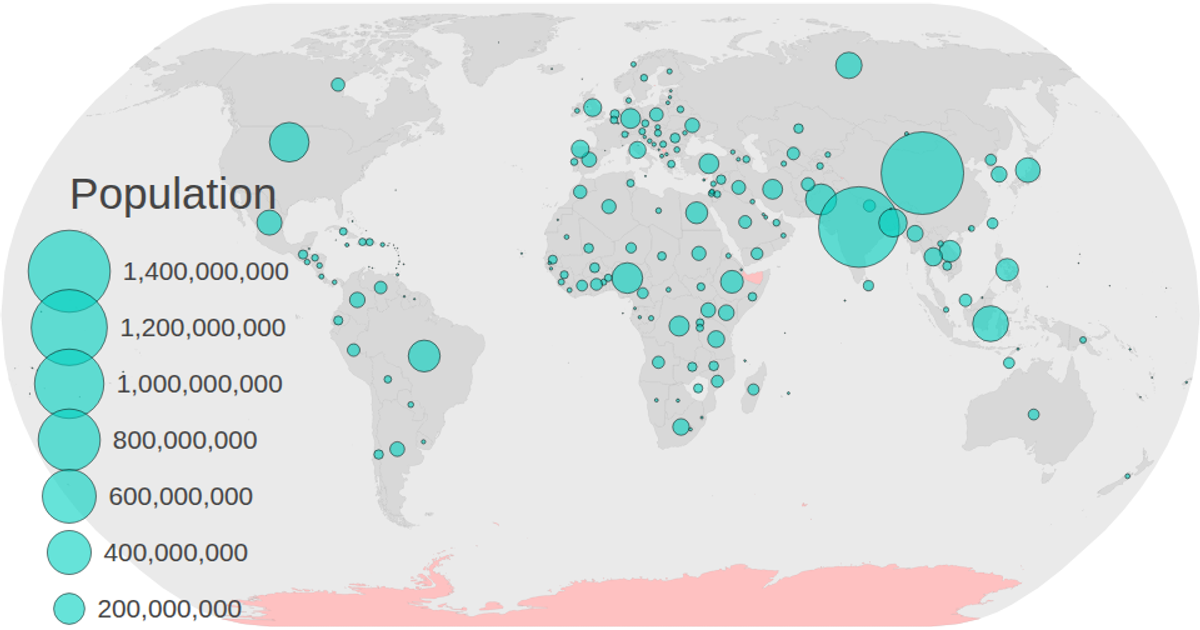
A world map rendered in SVG displays projected population estimates for 2050 as semi-transparent black circles sized by value and positioned at each country’s centroid. The visualization uses `d3.geoNaturalEarth1` and `d3.geoPath` to draw the map, `d3.scaleSqrt` for proportional circle radii, and `d3.zoom` for panning and zooming. Animated circle transitions appear sequentially, while a static legend from `colorLegend.js` lists population values. Data comes from a CSV joined to TopoJSON country geometries.
AI-generated descriptionMIT Licensed



Comments
Sign in to join the discussion.