🌍 Public
Covid Line Chart
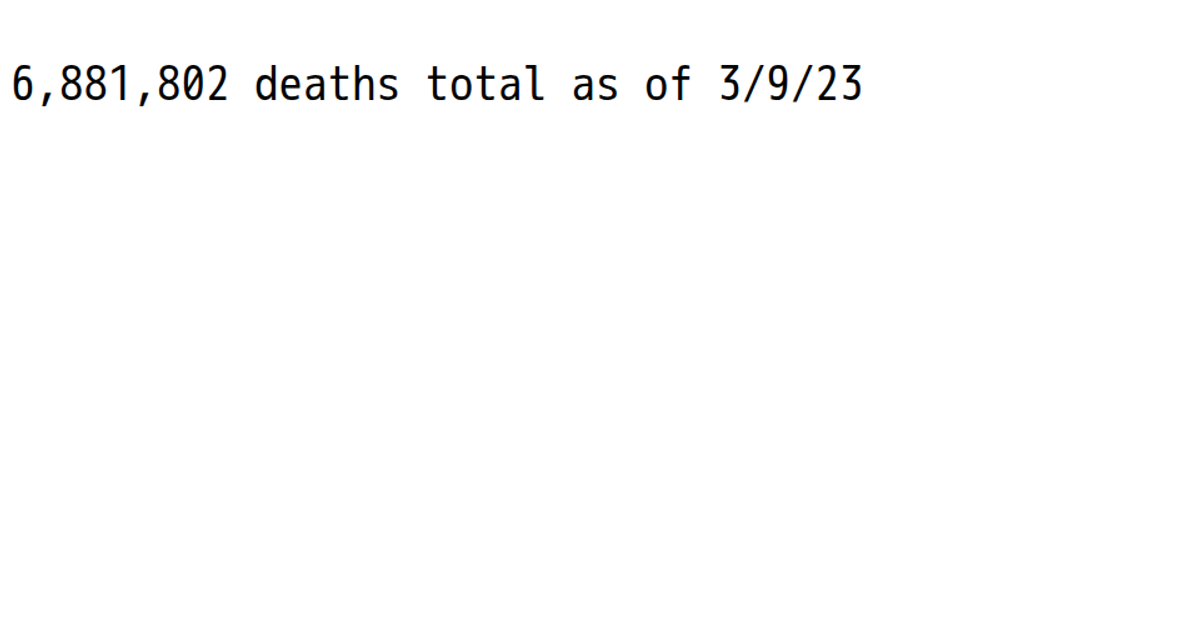
This example displays a single, stark statistic: the total number of global COVID-19 deaths as of the latest date in the data. It extracts the last column from a CSV file provided by the Johns Hopkins CSSE repository, sums all values, and formats the total with a thousands separator. The React app uses `d3.csv` to fetch and parse the data, while a `d3.format` comma formatter renders the result in a large `<pre>` element. The visualization emphasizes the magnitude of the figure over a chart, showing the aggregate impact rather than a temporal trend.
AI-generated descriptionMIT Licensed




Comments
Sign in to join the discussion.