🌍 Public
D3 map
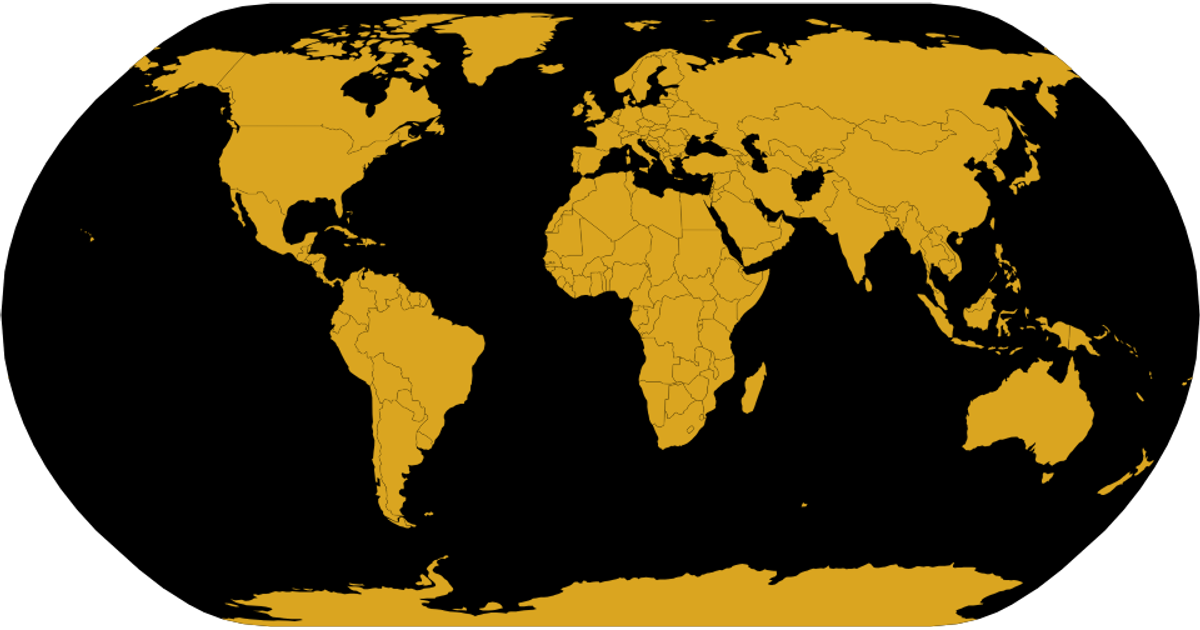
This example visualizes a world map using D3 v5 and TopoJSON, plotting museum object locations from a SPARQL query against the Netherlands Digital Heritage Network’s NMVW dataset. A natural Earth projection renders country boundaries and a black sphere, while white circles animate onto coordinates using `d3.geoPath` and `d3.easeBounce`. Each circle’s position is computed from latitude and longitude via the projection, with staggered transitions revealing the data points sequentially.
AI-generated descriptionCreating a map with data in d3
This example will show how to load data into d3 to create a worldmap
I've based this off of Curran's map example
MIT Licensed



Comments
Sign in to join the discussion.