🌍 Public
Scatter Plot with gradient mask
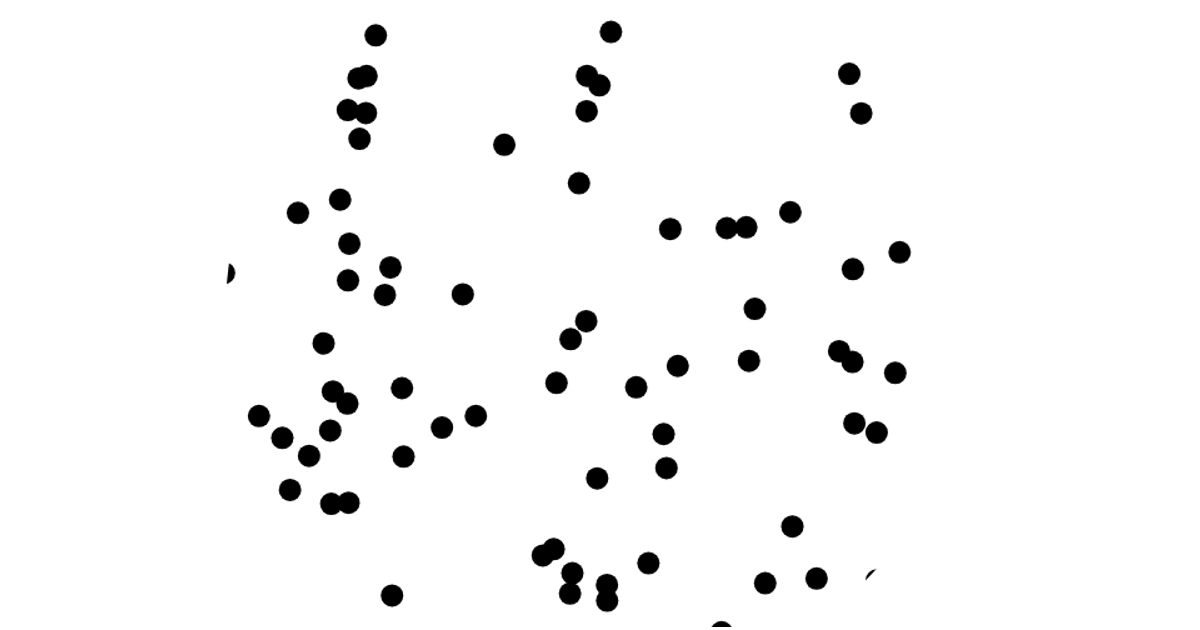
A full-screen scatter plot displays 2,000 random points individually as white circles, revealing a large red-to-blue linear gradient only through the circular gaps. The random point coordinates are generated with a custom `generateRandomPoints` function. The code applies the gradient to a single circle, then defines an SVG `<mask>` containing the white point circles to cut the gradient shape, demonstrating mask-based data visualization with d3 v6.
AI-generated descriptionTesting scatter plot masks.
MIT Licensed




Comments
Sign in to join the discussion.