🌍 Public
D3 Scatter Plot with mask
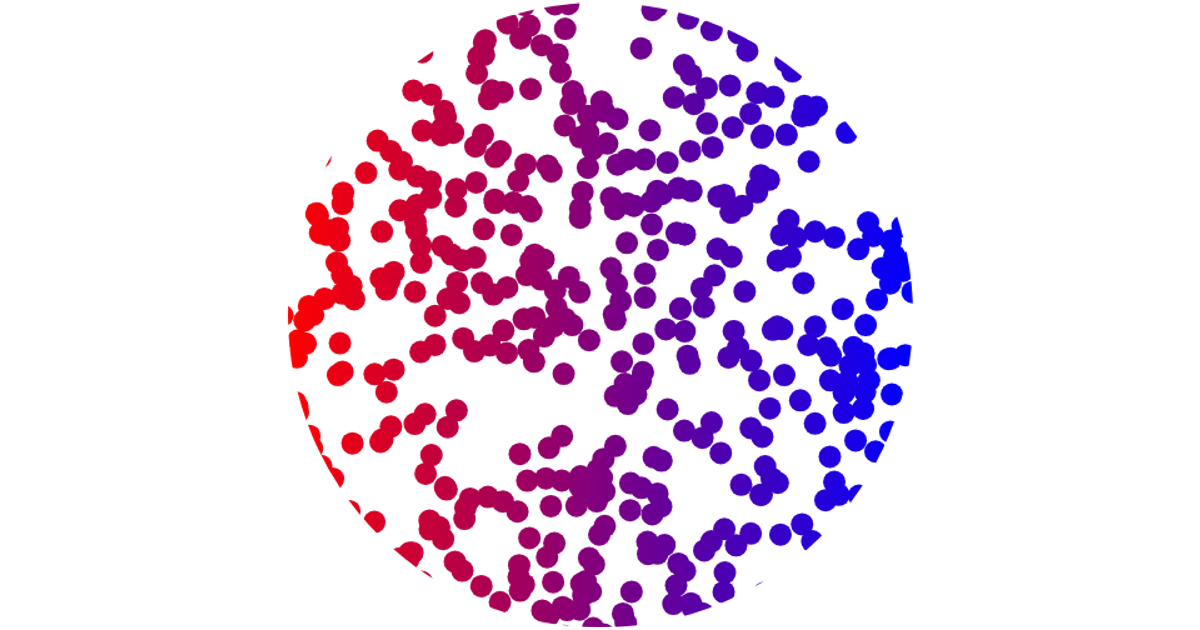
This example displays a scatter plot of 200 randomly generated points, each rendered as a small black circle. A circular mask, centered on the canvas, is applied to the SVG group, revealing only the points that fall within its bounds. The visualization uses the D3.js library (v6) for random point generation and SVG rendering. A mask element with a white circle over a black rectangle defines the visible region, creating a spotlight effect on the data.
AI-generated descriptionA reusable scatter plot inspired by Towards Reusable Charts.
Shows the Iris Dataset.
MIT Licensed



Comments
Sign in to join the discussion.