🌍 Public
D3 Scatter Plot Socioeconomic
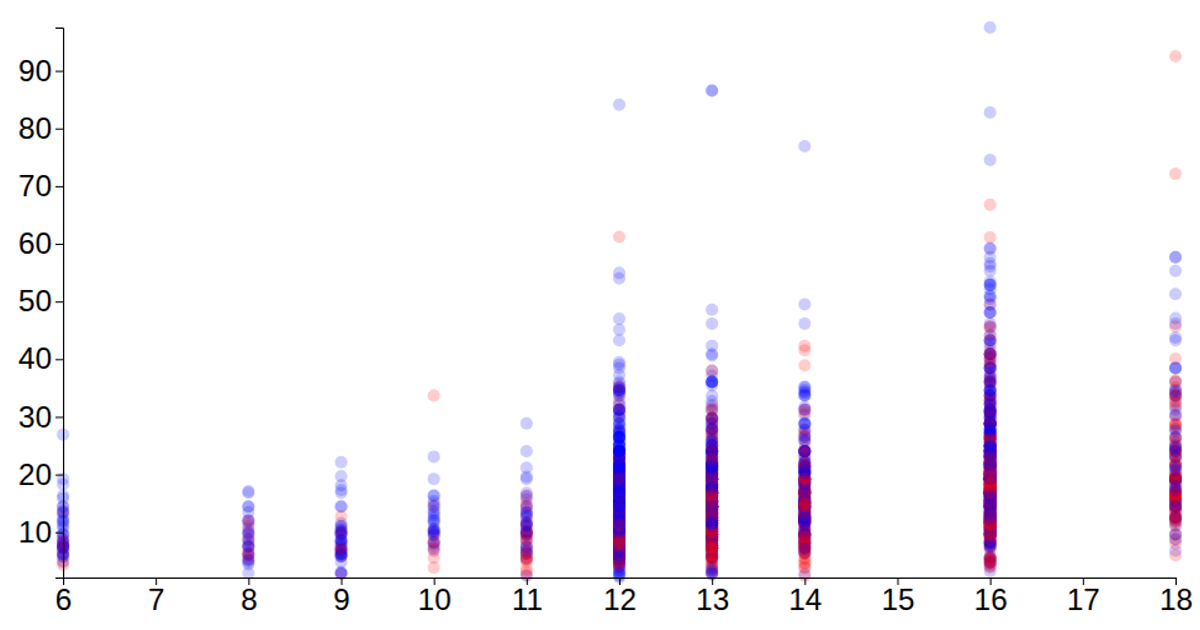
This scatter plot visualizes socioeconomic data from the US Census 2019-2010 American Community Survey, displaying employment counts by state and NAICS sector for 2019. The visualization uses D3 v6 with SVG rendering, employing `d3.csv` to load the data and `d3.scaleLinear` and `d3.scalePoint` for positioning. Points are plotted using the `Estimate` values for employed civilians, with `d3.axisLeft` and `d3.axisBottom` providing labeled axes. User interactions are not apparent, as the code focuses on static scatter plot generation.
AI-generated descriptionA visualization of Socioeconomic data extract from US Census 2019-2010 American Community Survey by US state. The visualization shows the count of people employment by NACIS Sector for the year 2019.
MIT Licensed





Comments
Sign in to join the discussion.