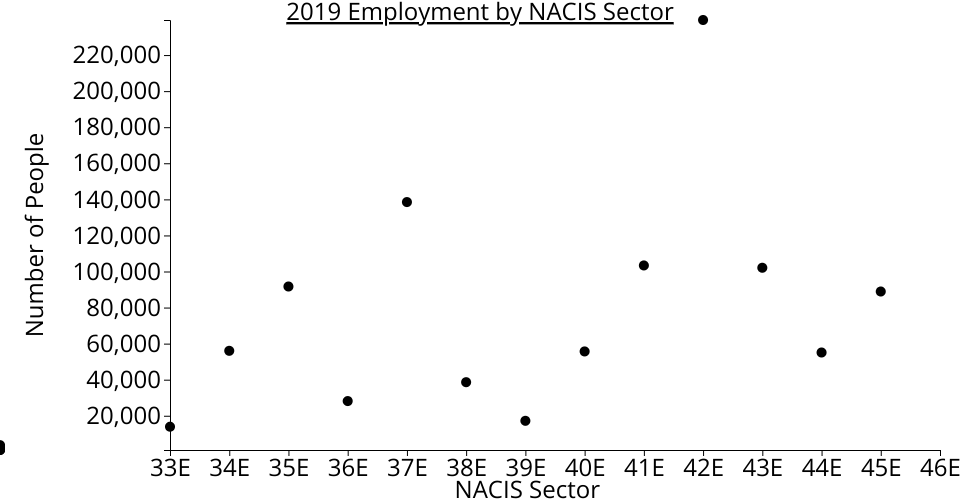
A visualization of Socioeconomic data extract from US Census 2019-2010 American Community Survey by US state. The visualization shows the count of people employment by NACIS Sector for the year 2019.
MIT Licensed
A visualization of Socioeconomic data extract from US Census 2019-2010 American Community Survey by US state. The visualization shows the count of people employment by NACIS Sector for the year 2019.