🌍 Public
Fork of World Countries Tree to RiskSystem
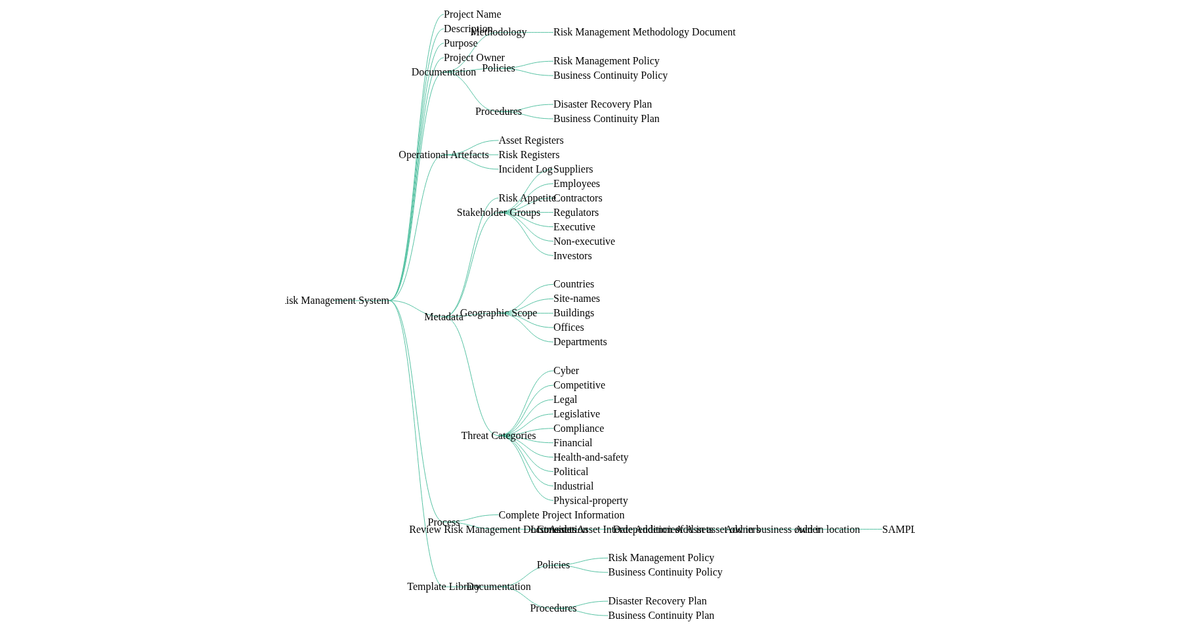
This interactive tree diagram visualizes the hierarchical structure of a Risk Management System, displaying project information, documentation, operational artefacts, metadata, process steps, and template libraries as nested nodes. Built with d3.v5, the visualization uses the `tree` layout and `linkHorizontal` path generator to create an SVG-based dendrogram. The `zoom` API enables panning and zooming across the full-width layout. Node labels are rendered with font sizes scaled by depth, and all data comes from a local `data.json` file.
AI-generated descriptionMIT Licensed






Comments
Sign in to join the discussion.