🌍 Public
Fork of World Countries Tree RiskManagement Take 2
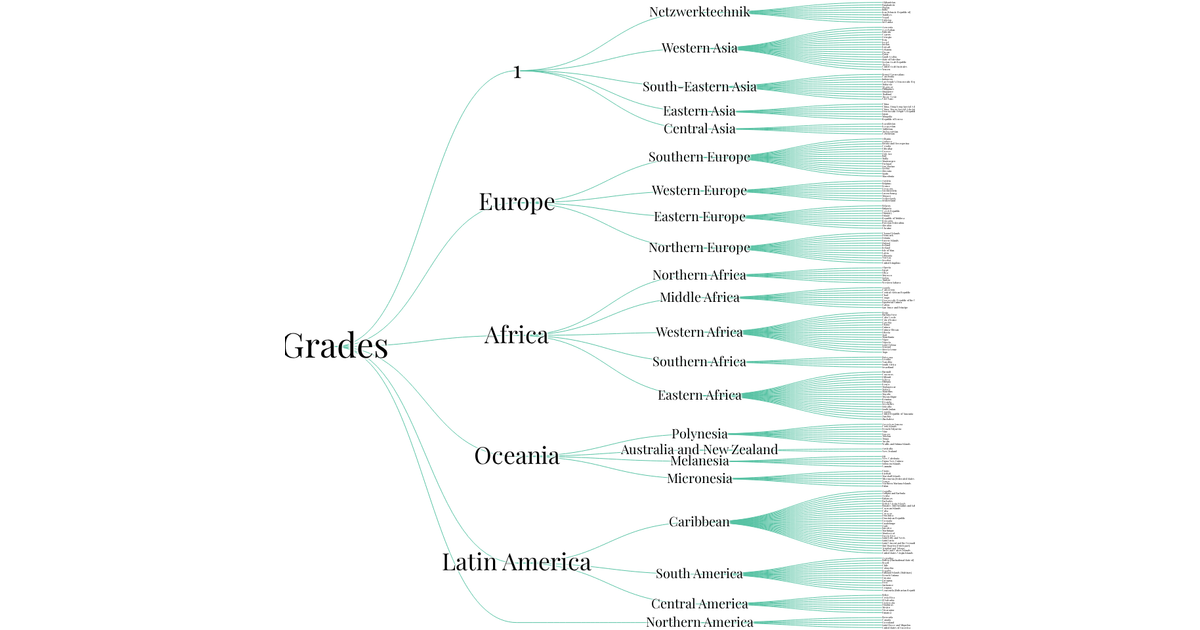
This example displays a hierarchical tree visualization of a risk management system, with branches for project information, documentation, operational artifacts, and processes. It uses D3 v5’s `tree` layout and `linkHorizontal` generator to render nodes and links as SVG paths. Node labels are positioned by depth, with text overflow handled via CSS. The visualization supports zooming through D3’s `zoom` behavior, and loads hierarchical data from a local `data.json` file.
AI-generated descriptionMIT Licensed





Comments
Sign in to join the discussion.