🌍 Public
Choropleth Map
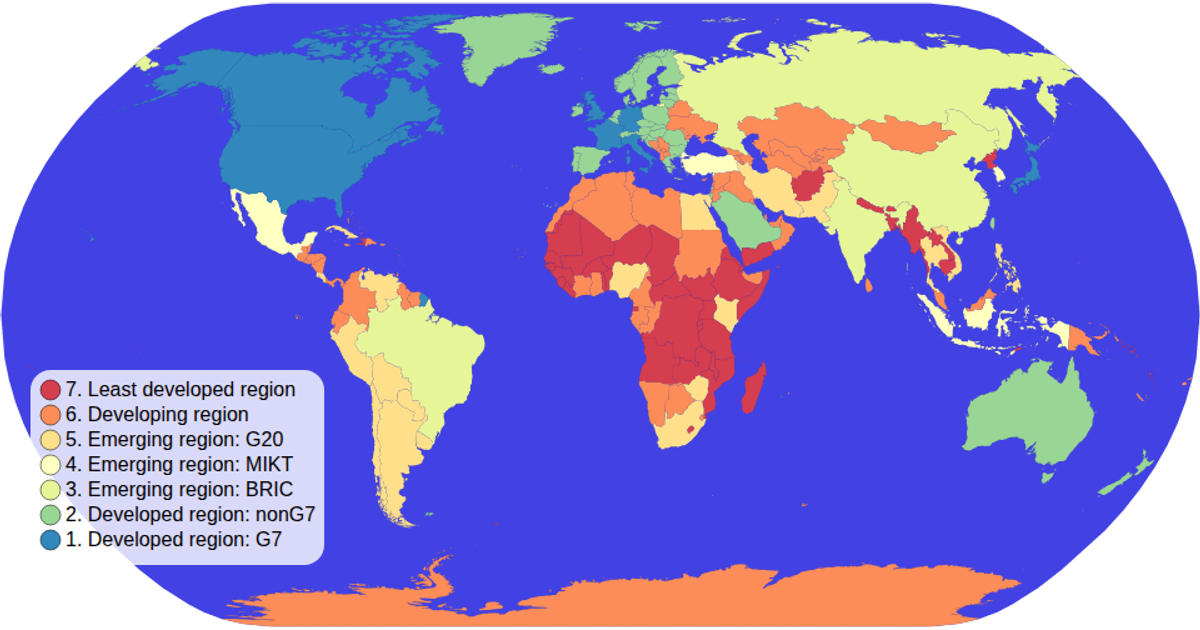
A choropleth map visualizes passenger counts by country with a green color scale, showing geographic distribution of aviation traffic. The visualization uses D3 v5's geoNaturalEarth1 projection and geoPath to render world map data from world-atlas TopoJSON, while CSV data provides country codes and passenger values. Countries are colored using scaleOrdinal with schemeGreens, and interactive zooming is implemented via D3's zoom module.
AI-generated descriptionMIT Licensed







Comments
Sign in to join the discussion.