🌍 Public
Plotting Points on a Map
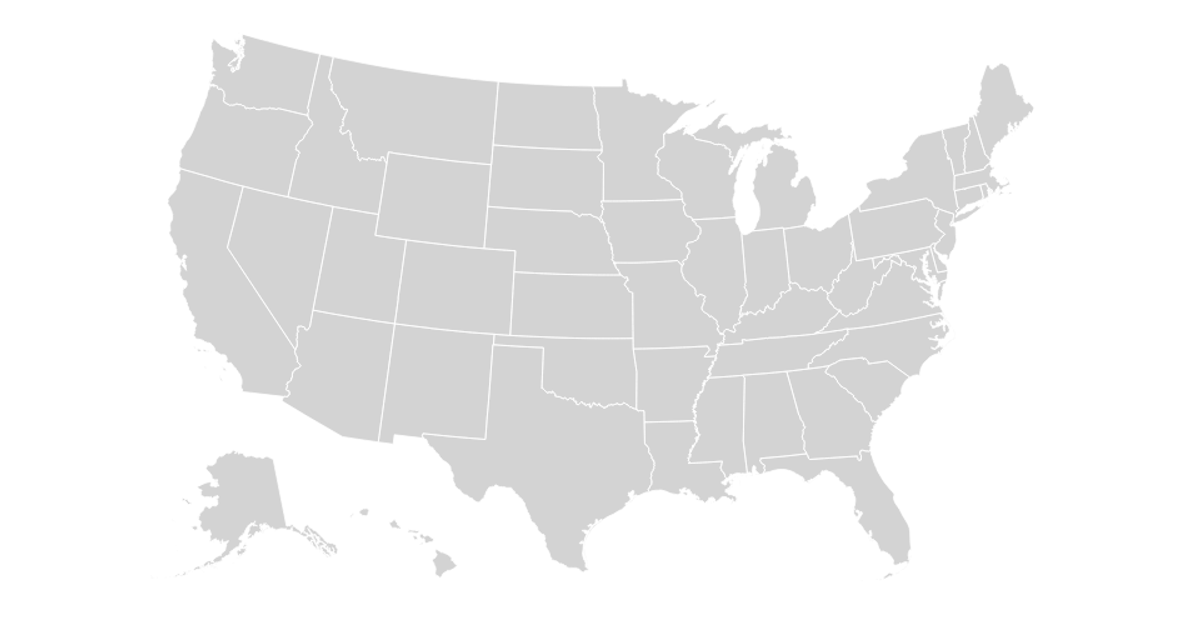
This visualization renders the contiguous United States from a TopoJSON dataset, mapping state boundaries and a light gray national background onto an SVG canvas. It uses the `d3.create` API to build the SVG element and the `topojson-client` feature function to convert the topology into geographic paths, which are then drawn with `d3.geoPath`. The code applies white strokes for state borders with rounded joins and caps, producing a clean, minimal choropleth base map without additional data layers.
AI-generated descriptionA reproduction of a Sol LeWitt art piece
MIT Licensed



Comments
Sign in to join the discussion.