🌍 Public
State Graph
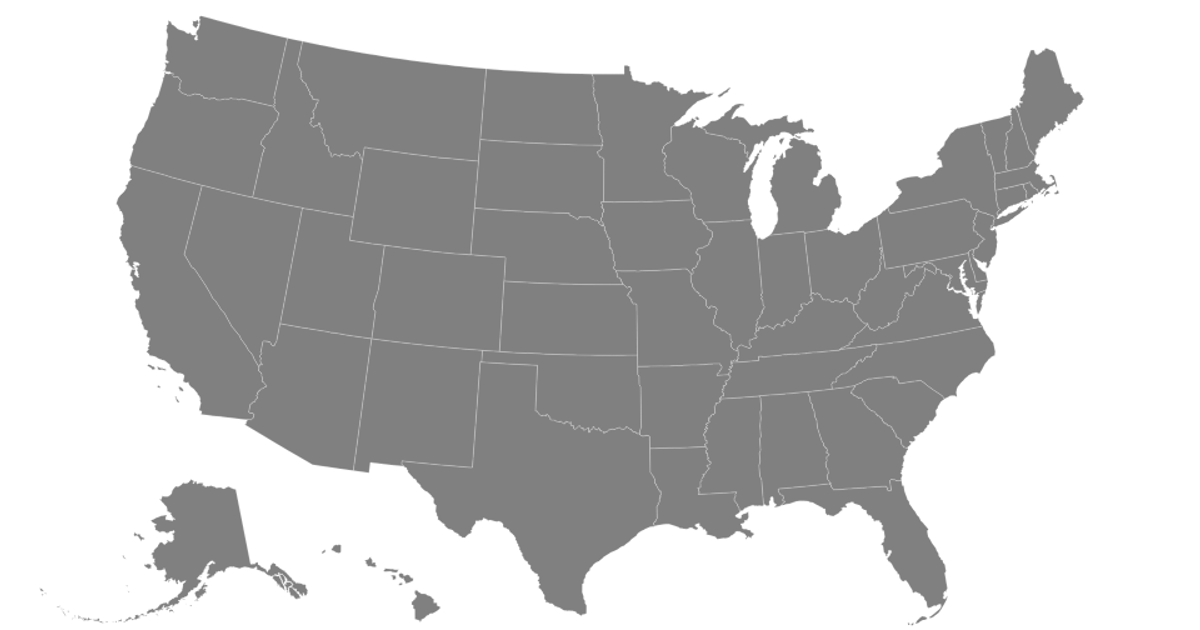
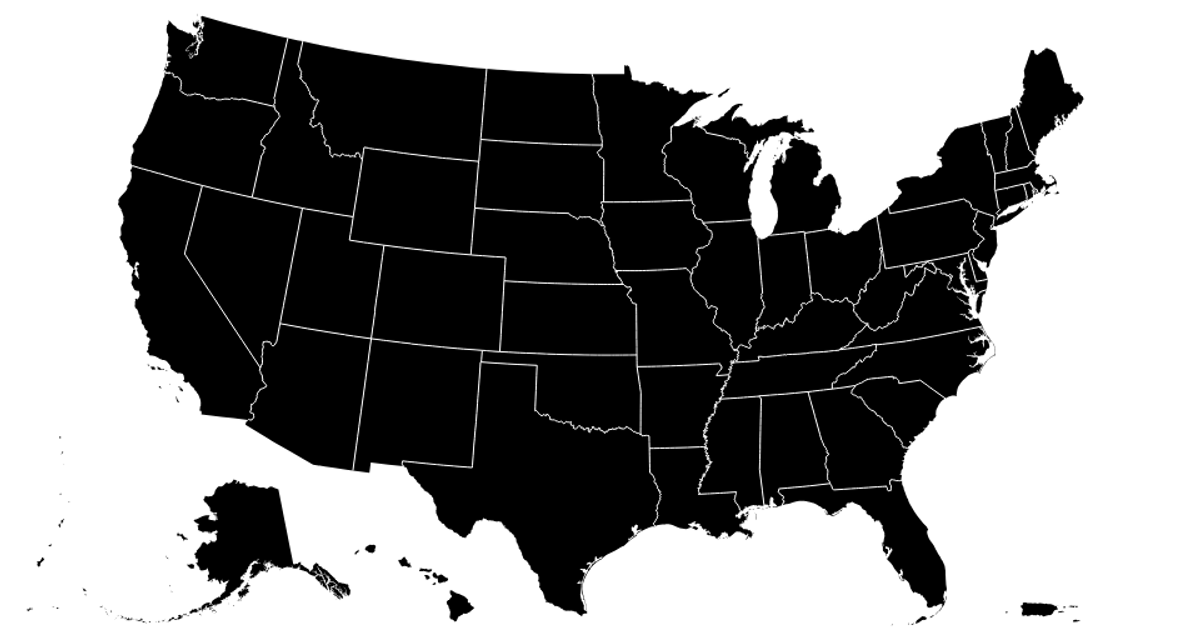
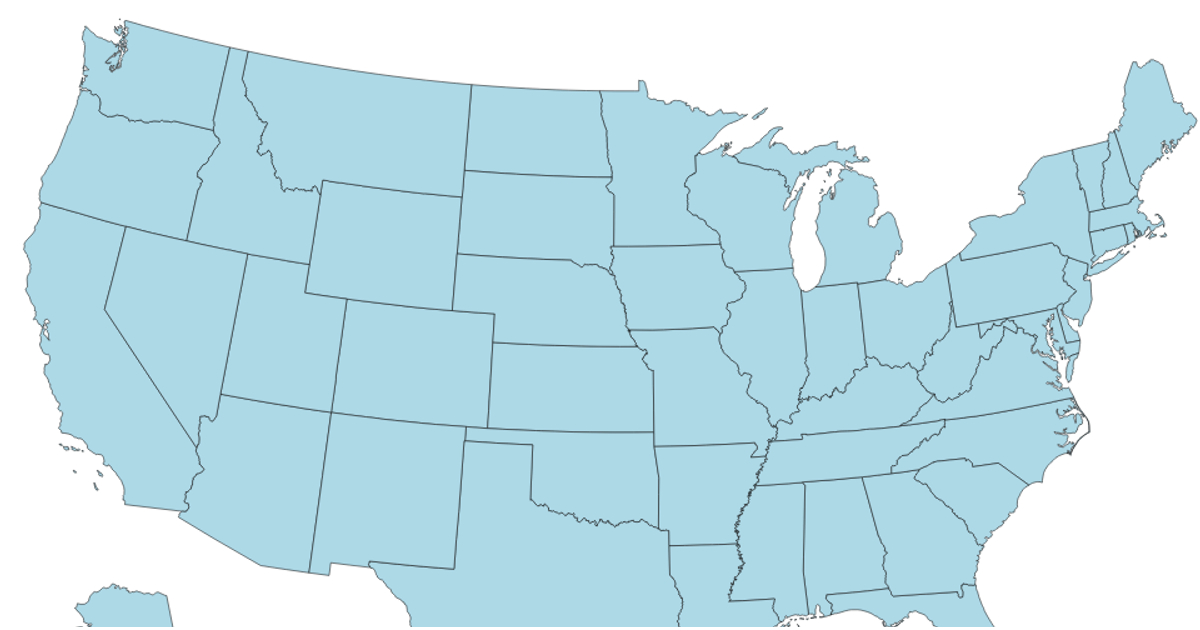
This example displays a choropleth-style map of the United States, with each state rendered as a light gray polygon and white borders separating them. It loads the US TopoJSON data from `us-10m.v1.json` and uses `d3.geoPath` to project the state features. The code applies a scale transform to the SVG to adjust the map’s size and vertical position. The visualization uses D3 v4 and TopoJSON v2, with the map drawn as SVG paths.
AI-generated descriptionMIT Licensed





Comments
Sign in to join the discussion.