🌍 Public
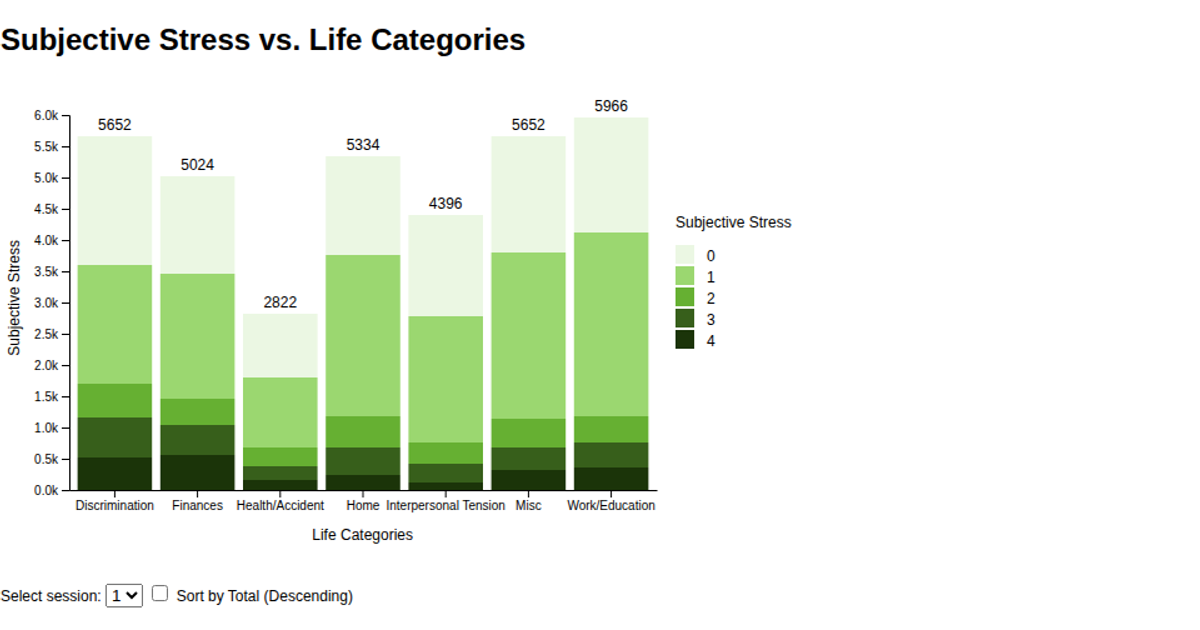
Subjective Stress vs. Life Categorie (Percentage Value)
This stacked bar chart shows the percentage distribution of subjective stress levels across seven life categories for a selected session, with an option to sort categories from most to least stressed. Stress levels are encoded as ordinal color segments using a five-step green scale. The D3 v6 code loads CSV data from a GitHub repository, uses `d3.stack()` and `d3.scaleOrdinal` for stacking and coloring, and provides interactive filtering via a dropdown and checkbox. Transitions animate bar updates using `transition.attr`, and a `d3.legendColor` legend clarifies the stress scale.
AI-generated descriptionA bare minimum HTML page demonstrating use of CSS and JavaScript.
See also React Starter.
MIT Licensed




Comments
Sign in to join the discussion.