🌍 Public
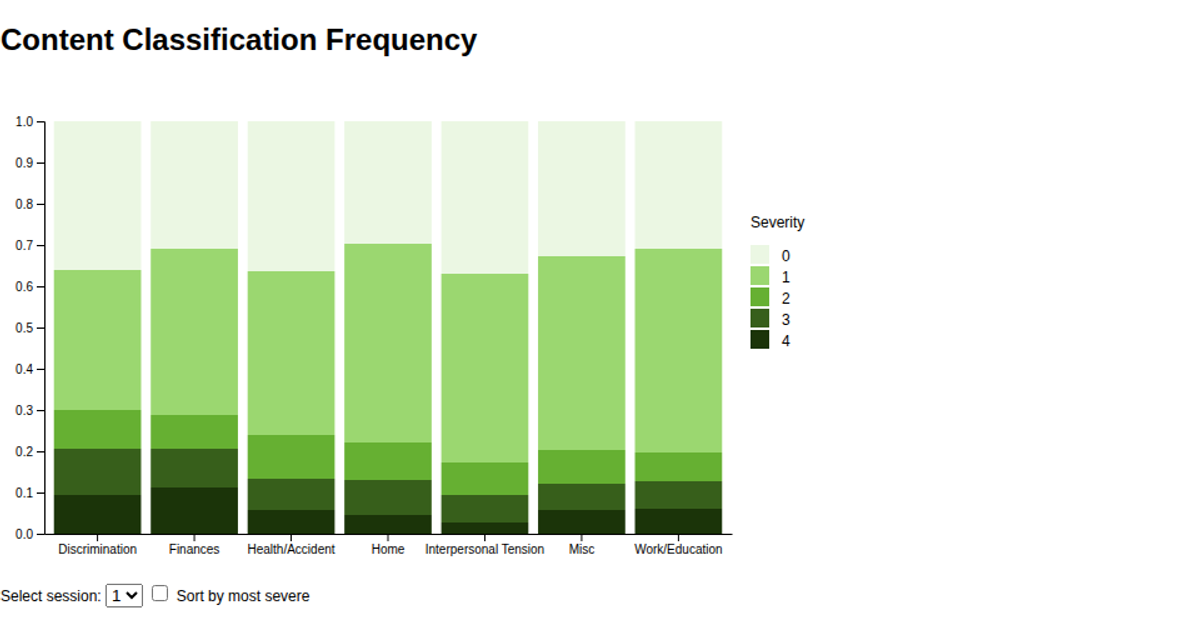
Content Classification Frequency
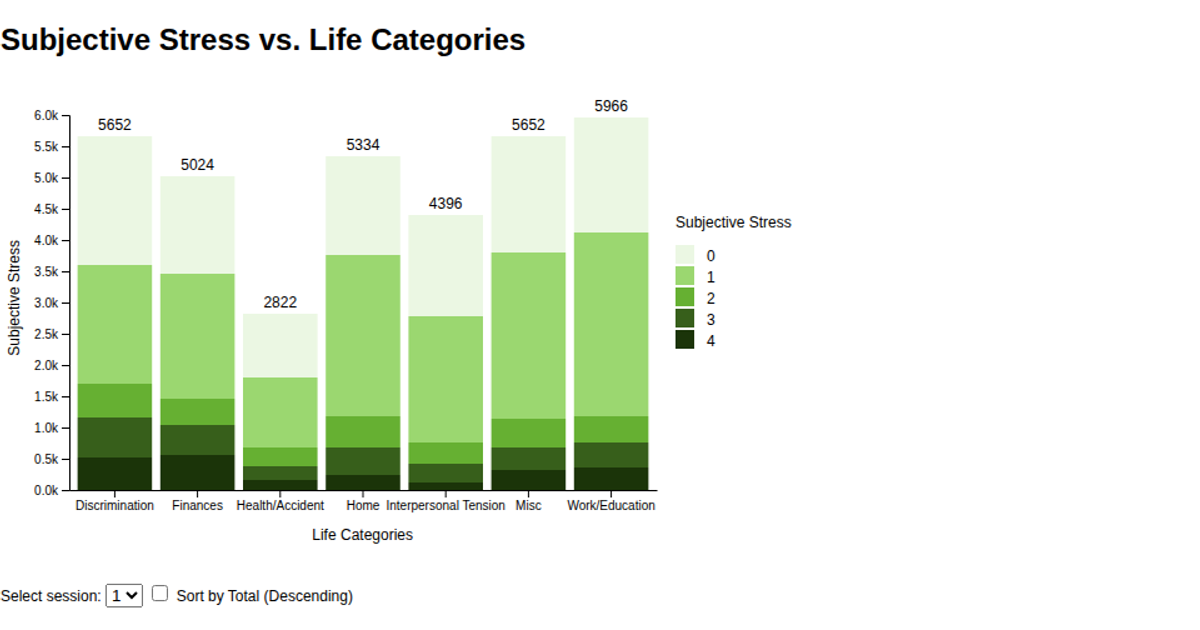
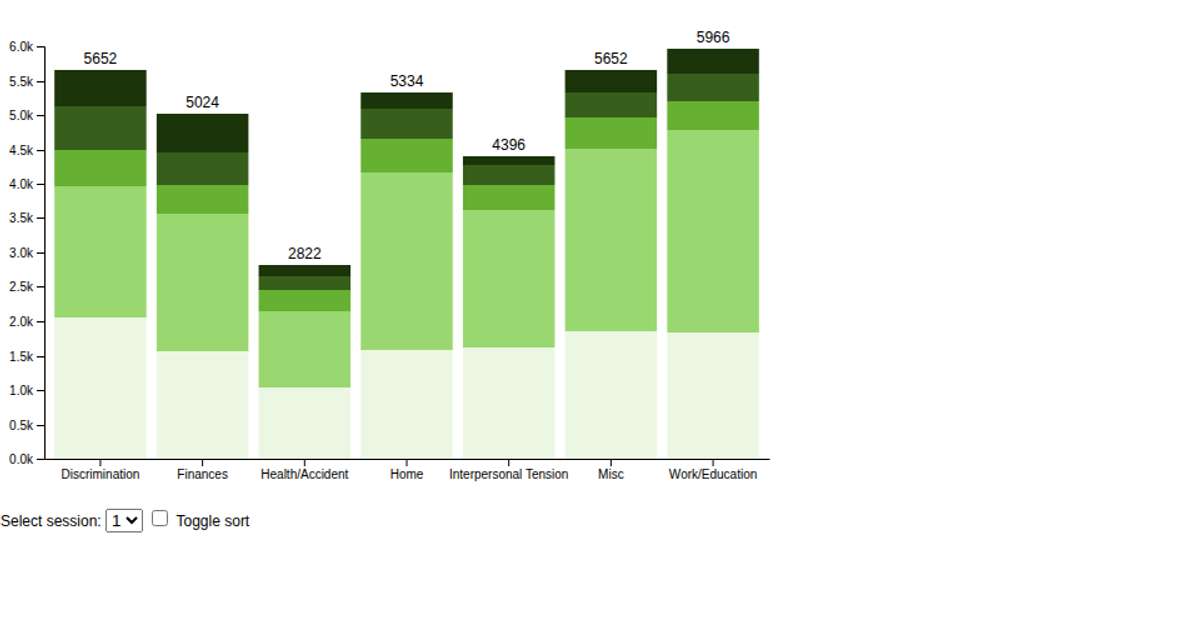
This visualization shows how subjective stress levels are distributed across seven life categories for each session, using stacked horizontal bars colored by stress intensity. Users select a session from a dropdown and can optionally sort categories by severity. The chart is built with D3 v6, using `d3.stack`, `d3.scaleBand`, and `d3.scaleLinear`, with data loaded via `d3.csv` from a GitHub-hosted CSV file. Animated transitions update the bars smoothly, and a `d3.legendColor` legend maps stress levels to a green color scale.
AI-generated descriptionA bare minimum HTML page demonstrating use of CSS and JavaScript.
See also React Starter.
MIT Licensed




Comments
Sign in to join the discussion.