🌍 Public
Let's make a map with D3.js!
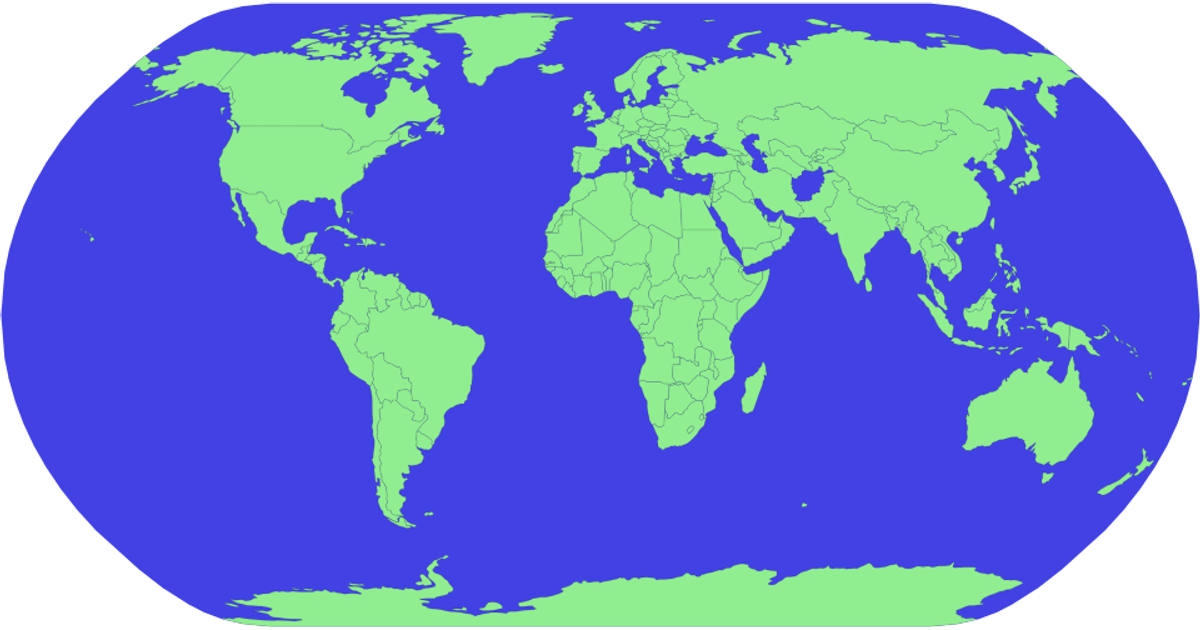
This example demonstrates how to build a map using the D3.js library. It loads GeoJSON data from a file and projects it using the `d3.geo.mercator` projection, with the map centered and scaled to fit the view. The code uses `d3.json` to fetch the data and `d3.geo.path` to generate SVG paths for each feature, styling them as the "zipcode" class. The page includes a YouTube tutorial video in an iframe, and the map is rendered as an SVG element with a blue sphere background.
AI-generated descriptionMIT Licensed




Comments
Sign in to join the discussion.