🌍 Public
The six paramitas
NNita
Last edited Jul 18, 2025
Created on Jul 17, 2025
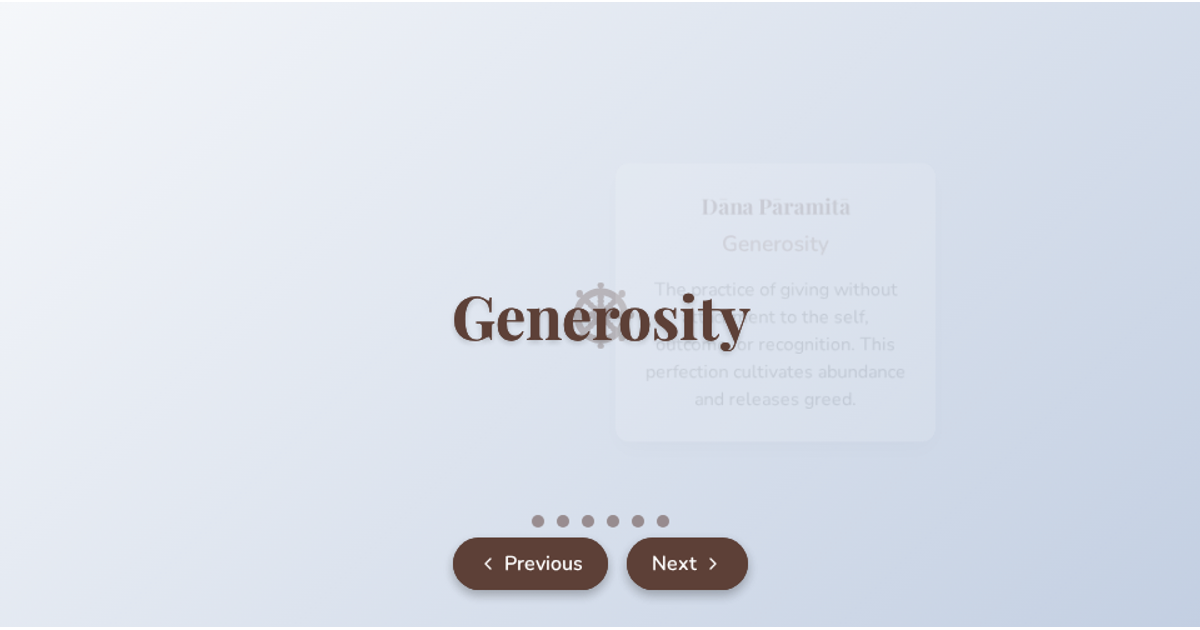
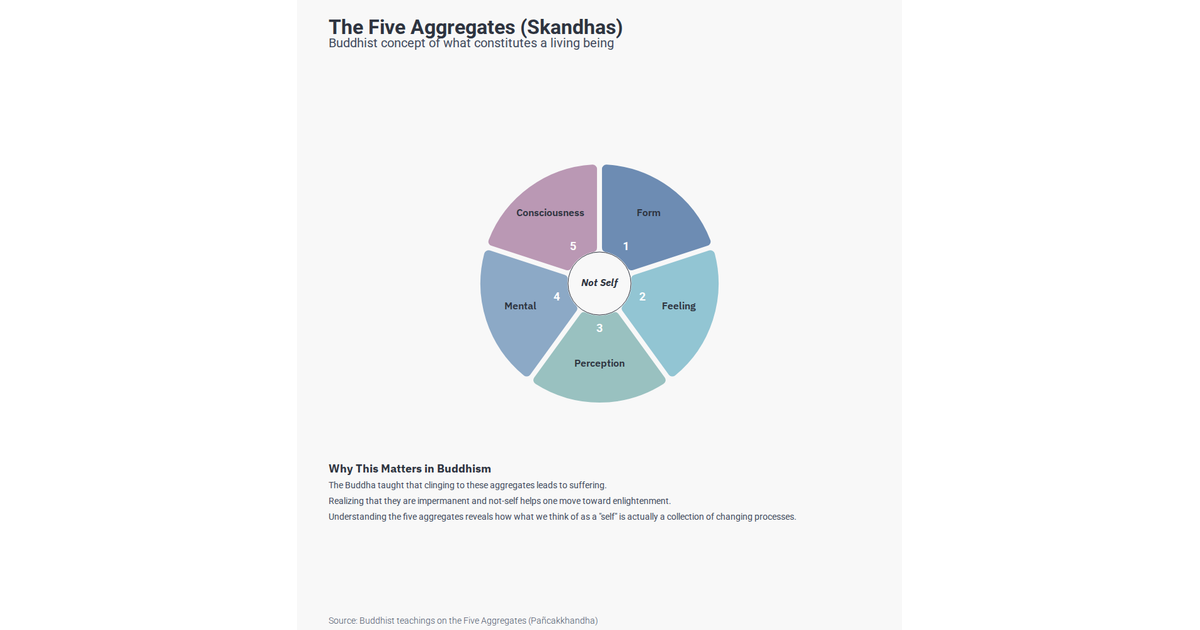
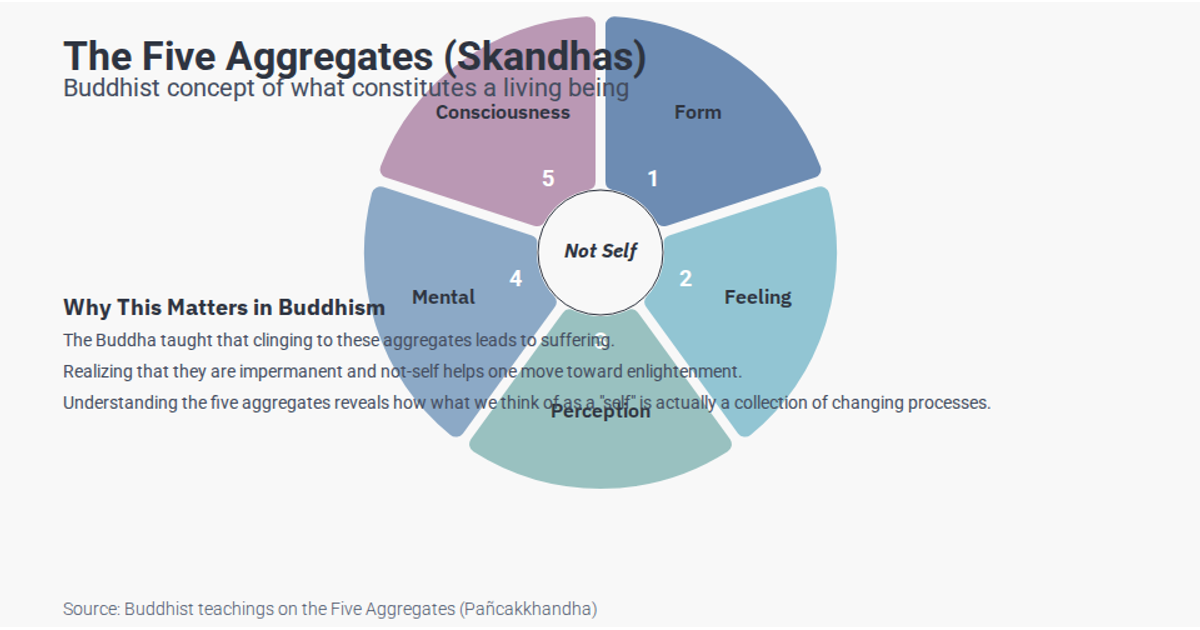
An interactive donut chart depicts the six Buddhist pāramitās, with each arc sized by a numerical value and colored distinctly. Clicking an arc highlights it, dims the others, and displays its name and description below. Built with React and D3 v7, the visualization uses `d3.pie()` and `d3.arc()` for the wheel layout, while the `ResizeObserver` hook adapts the SVG to container dimensions. Data loads from a local CSV file, and CSS animations add gentle floating and sparkle effects.
AI-generated descriptionMIT Licensed





Comments
Sign in to join the discussion.