D3 Scatter Plot Exercise
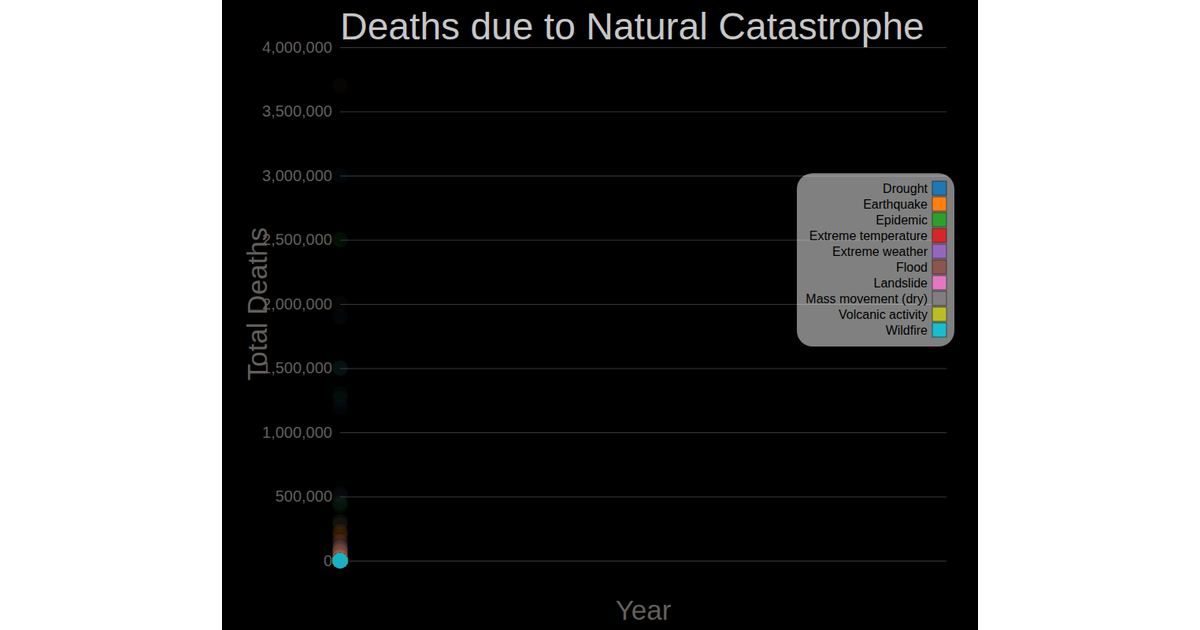
This scatter plot exercise displays the number of deaths from wildfires per year, using vertical bars to represent each data point. The chart, which reads from the `disasters.csv` dataset, maps the year on the x-axis and death count on the y-axis. The code builds an SVG visualization using D3 v7, employing `d3.scaleLinear` for both axes, `d3.axisBottom` and `d3.axisLeft` for tick labels, and `d3.csv` for data parsing. The bars are rendered as `rect` elements with a fixed width.
AI-generated descriptionThe data set I chose doesn't make sense to be displayed in a scatter plot so I made it into a bar chart instead. The outliers make it look ugly.
The data in this set represents the total deaths related to different categories of national disasters since the early 1900s.




Comments
Sign in to join the discussion.