🌍 Public
Fork of hw8_sankey
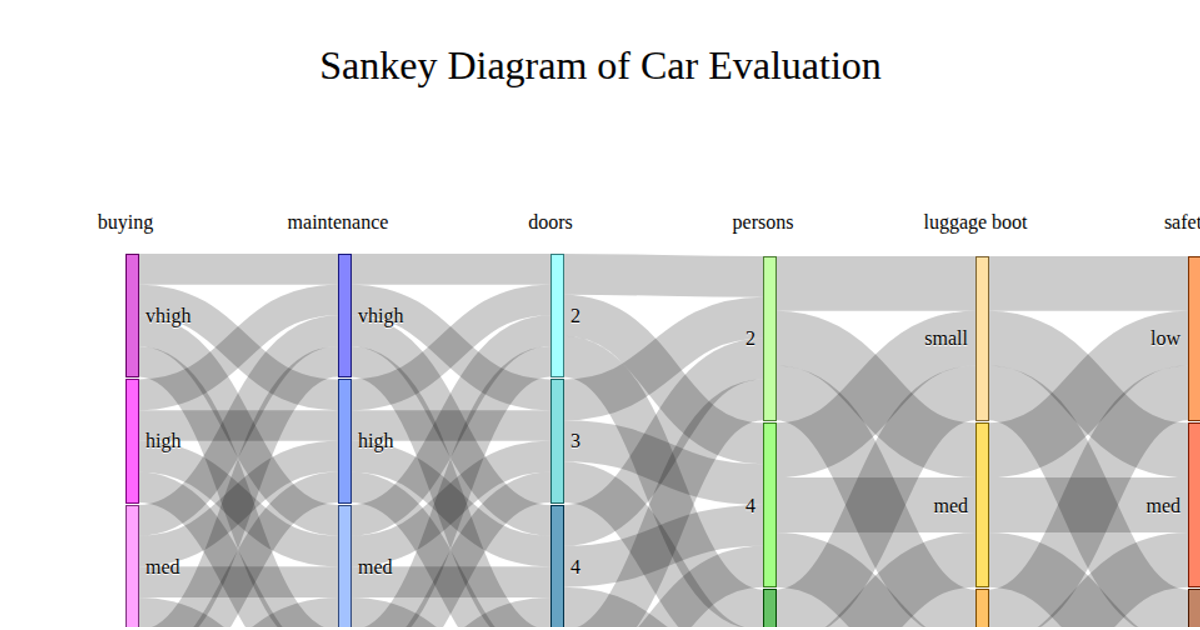
This example visualizes the Car Evaluation dataset using a Sankey diagram to show conditional probability relationships between categorical car attributes. The code computes pairwise ratios between attribute values, such as buying price and maintenance cost, and encodes these as link widths. It uses d3.csvParse to load the data and builds the diagram with d3.sankey, layout(1), and SVG rendering within a React framework. Node names combine column labels with their values to trace flows across six attribute dimensions.
AI-generated descriptionA bare minimum HTML page demonstrating use of CSS and JavaScript.
See also React Starter.
MIT Licensed







Comments
Sign in to join the discussion.