🌍 Public
109550187_HW8
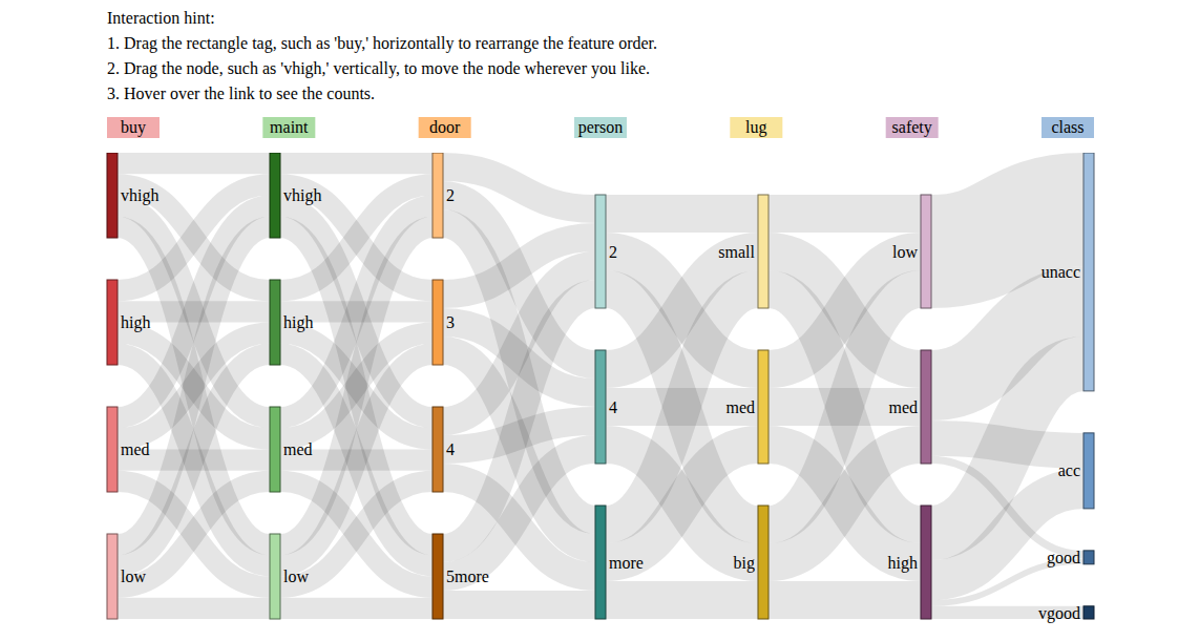
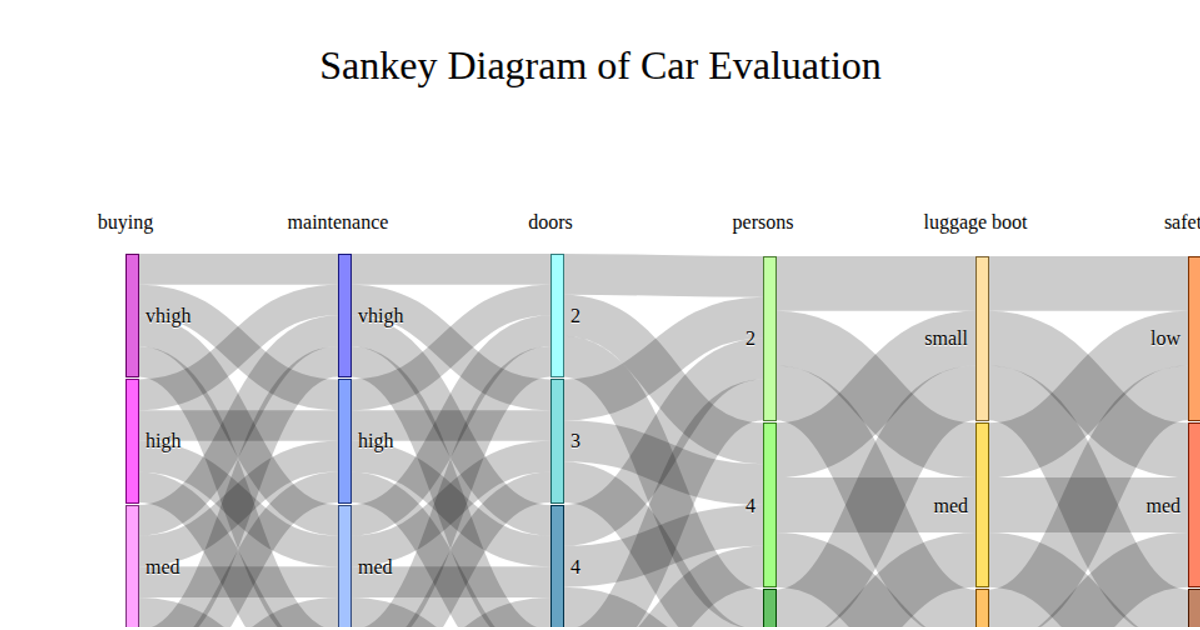
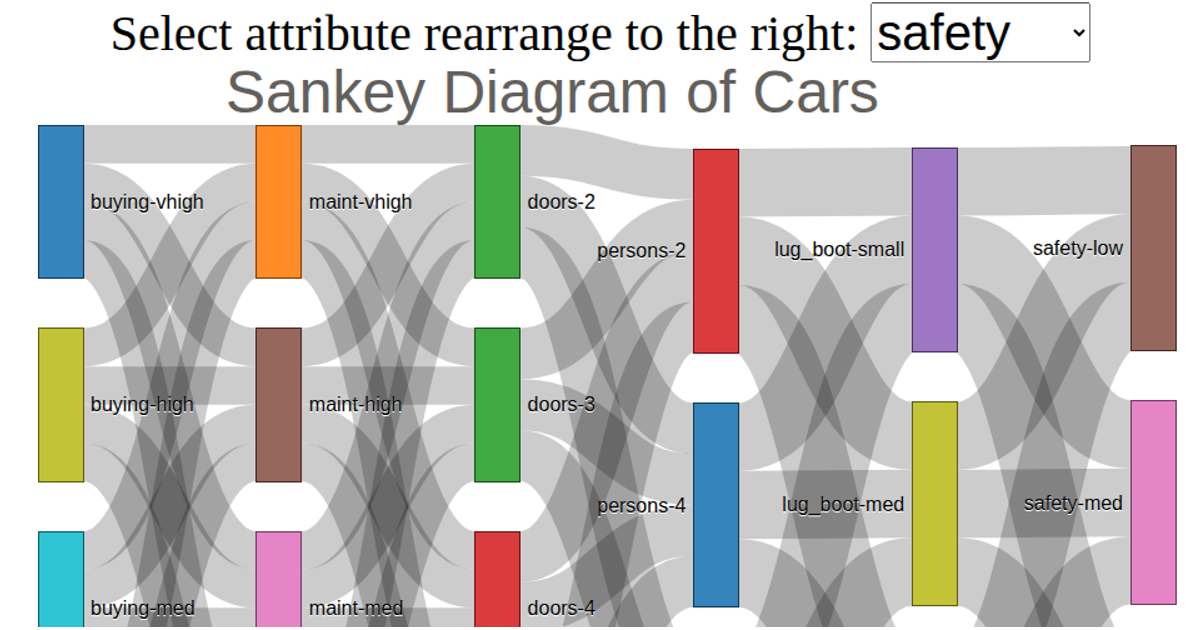
This visualization uses a Sankey diagram to show the flow of car attribute combinations from the UCI Car Evaluation dataset, sourced via a remote CSV file. It displays how categorical values for buying price, maintenance cost, doors, persons, luggage boot, and safety connect sequentially. The D3.js v4 code employs `d3.sankey()` for layout, `d3.csvParse` for data ingestion, and SVG rendering with `d3.drag()` for interactive node repositioning. Link stroke width represents frequency, while color encodes distinct source nodes.
AI-generated descriptionMIT Licensed




Comments
Sign in to join the discussion.