🌍 Public
good start to learn d3js
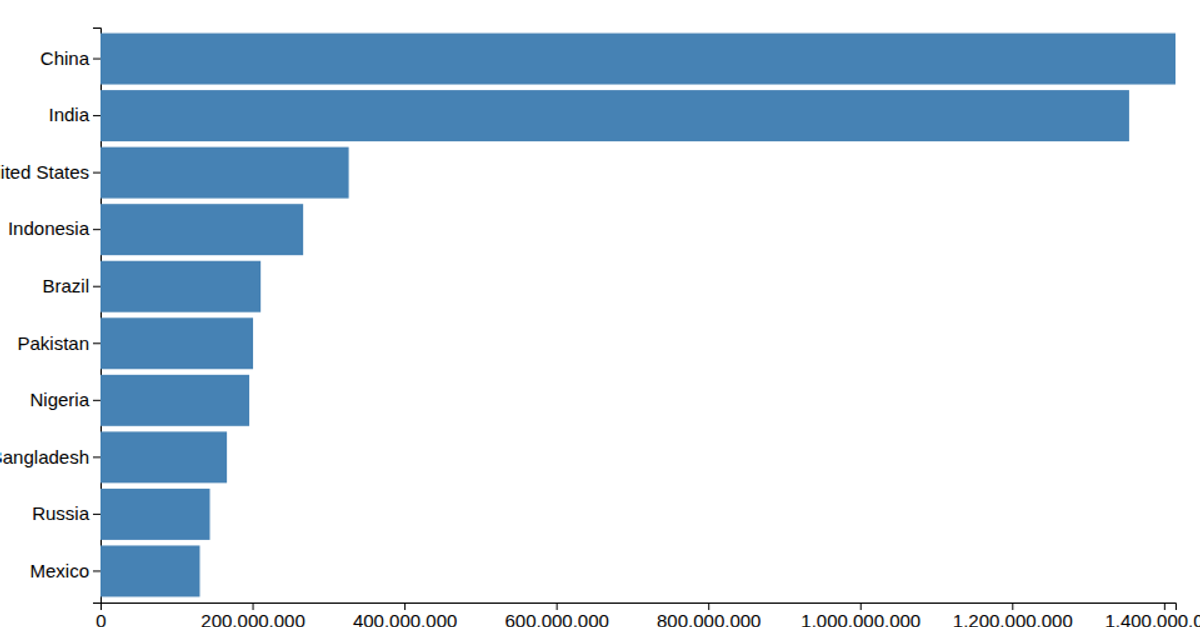
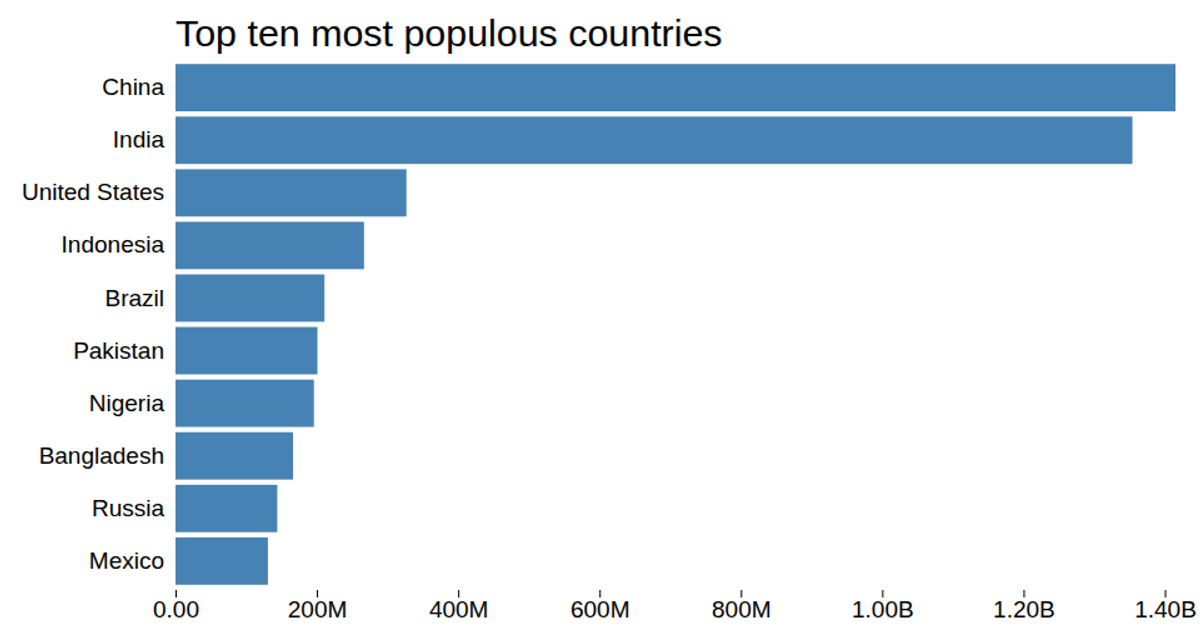
This example demonstrates basic data binding and SVG rendering with D3.js v5, displaying a horizontal bar chart of country populations loaded from a local CSV file. The code uses `d3.csv` to parse the data, `scaleLinear` and `scaleBand` to map population values and country names to pixel coordinates, and appends styled `<rect>` elements to the SVG container. The chart updates automatically when the CSV loads, with each bar’s height set to the band scale’s bandwidth. The source includes a linked video tutorial and a commented-out DOM manipulation example for a smiley face.
AI-generated descriptionDemonstrates fundamental DOM manipulation using D3.js by making a smiley face whose eyebrows move.
MIT Licensed




Comments
Sign in to join the discussion.