🌍 Public
making maps
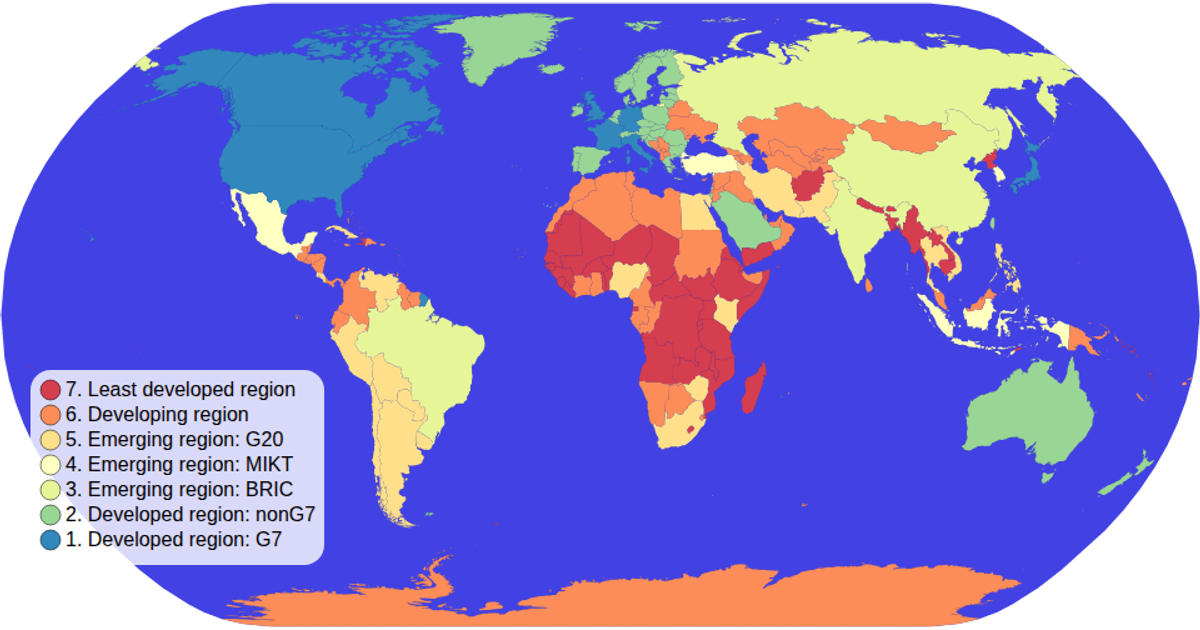
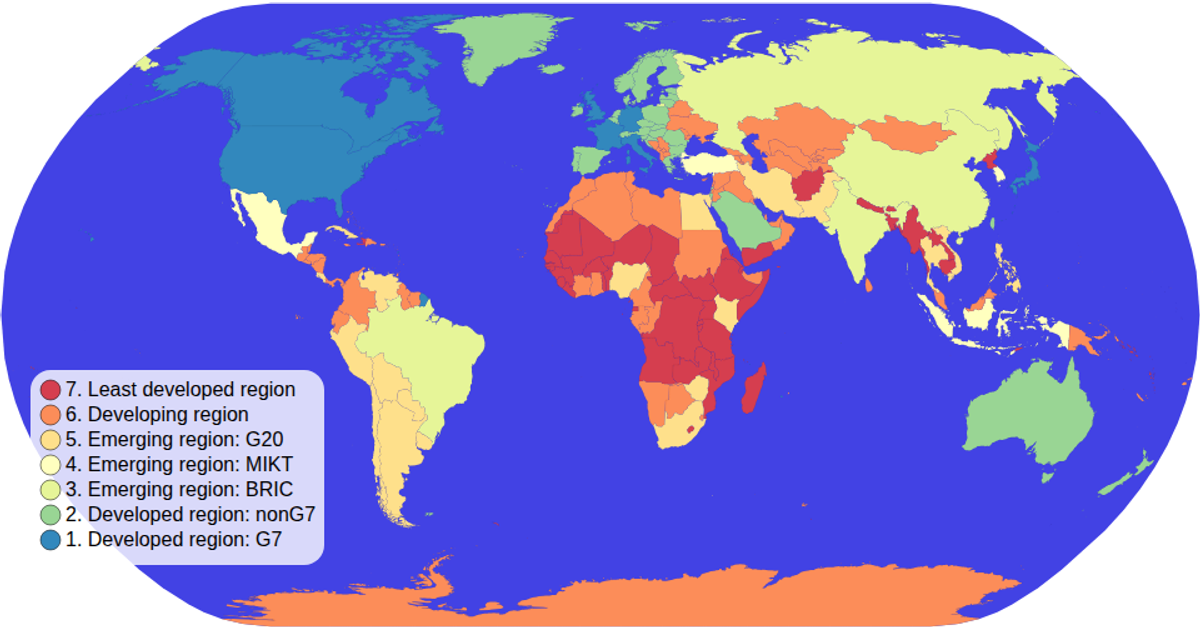
A choropleth map shows total clothing units produced by country, with aggregated production costs and sale prices revealed in tooltips. Built with D3 v7, it uses `d3.geoNaturalEarth1` for projection, `d3.geoPath` to render country shapes from TopoJSON world-atlas data, and `d3.rollup` to aggregate a 20-row CSV dataset by country. Labels and a legend clarify the weighted per-unit metrics, rendered as SVG with an interactive tooltip.
AI-generated descriptionMIT Licensed





Comments
Sign in to join the discussion.