🌍 Public
Fork of Coronavirus Deaths Over Time by Country With Voronoi Overlay
Nn.koldovsky@gmail.com
Last edited Aug 23, 2022
Created on Aug 23, 2022
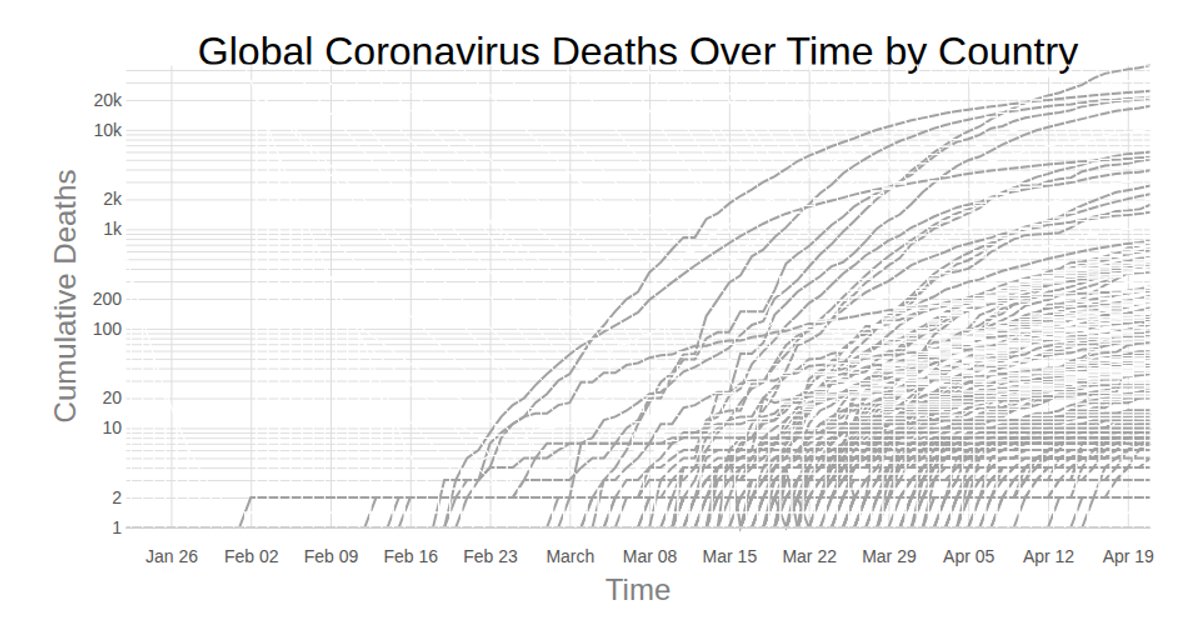
Multiple countries' cumulative COVID-19 death counts are plotted as thin gray lines on a log-scaled y-axis against time. A Voronoi overlay, generated via `d3.Delaunay` and `d3.delaunay.voronoi`, partitions the chart area so hovering any point highlights the nearest country's full line in black. Implemented in React with D3 v5, the chart loads the Johns Hopkins time-series dataset via `d3.csv` and renders all geometry as SVG, with axes created using `d3.axisBottom` and `d3.axisLeft`.
AI-generated descriptionLine chart of Coronavirus cases to date. Data from Johns Hopkins Coronavirus Dataset.
MIT Licensed



Comments
Sign in to join the discussion.