🌍 Public
ICE_8_NIHARIKA_WORLDMAP
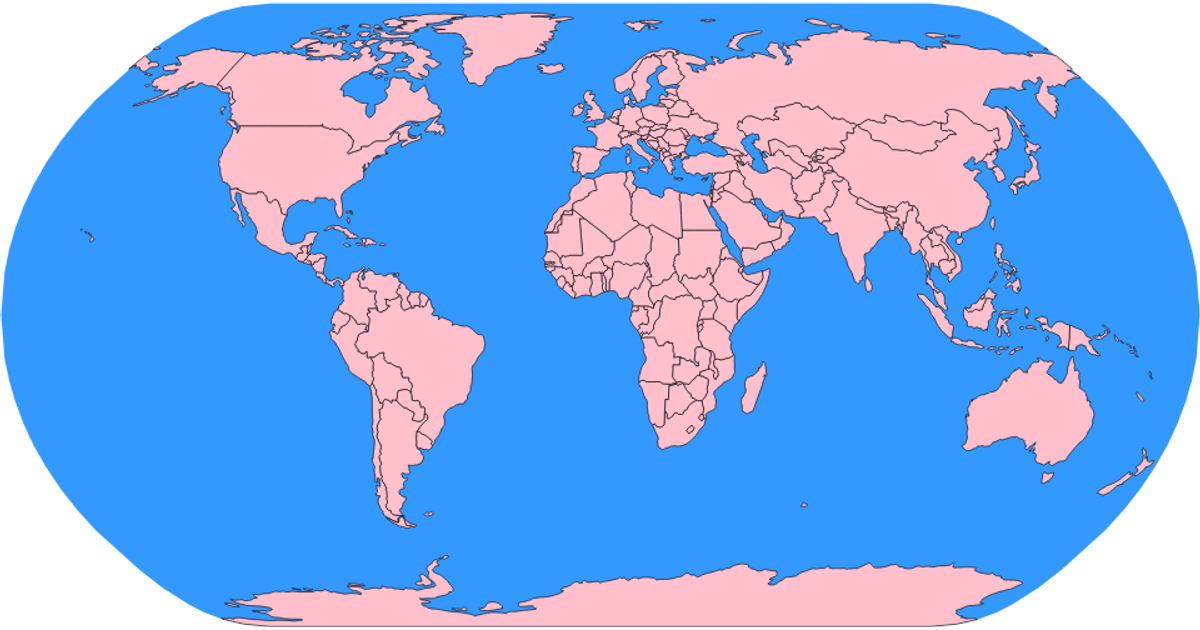
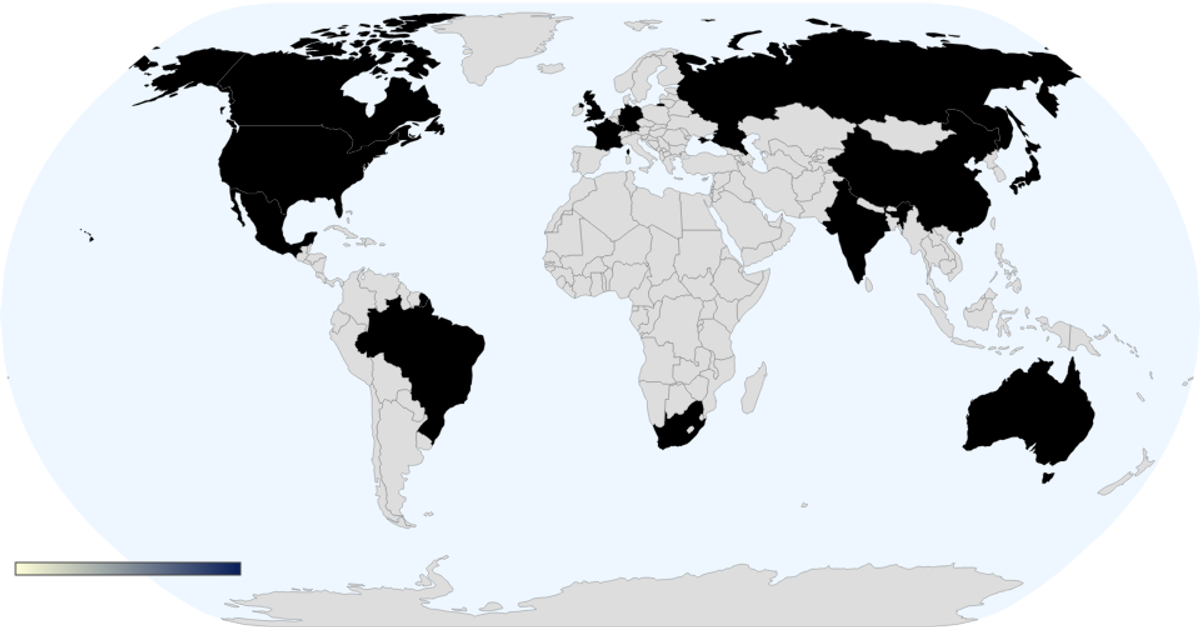
This world map visualizes life expectancy by country, with a dark choropleth color scale and a continuous legend. The visualization uses D3.js with TopoJSON client to convert world-atlas data, joining it with a CSV dataset containing life expectancy values. Hovering over any country reveals its name and the corresponding life expectancy in years. The map renders with a Natural Earth projection, graticule lines, and an ocean background.
AI-generated descriptionMIT Licensed




Comments
Sign in to join the discussion.